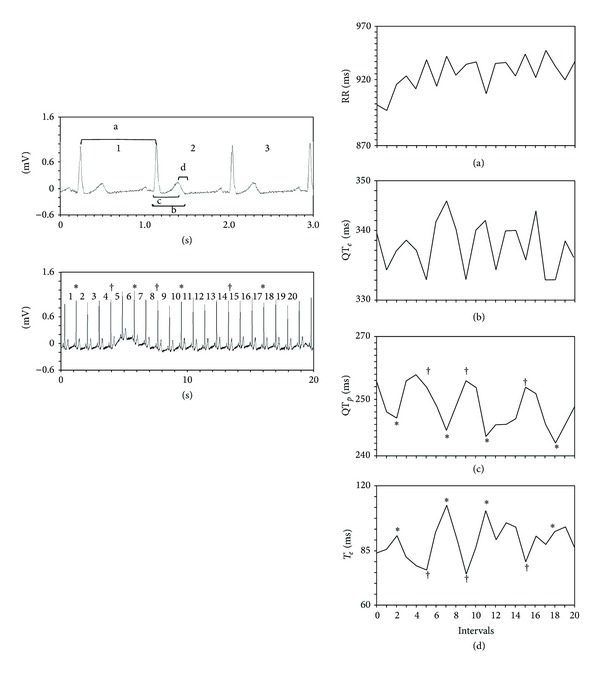
Figure 1.

The upper left panel shows the four intervals studied: a = RR; b = QTe; c = QTp; d = T e. The lower left panel shows a beat-to-beat ECG recording extended to include the first 20 beats with the relative RR intervals. The right panels give the RR (a), QTe (b), QTp (c), and T e (d) intervals measured on the 20 beats shown in the lower left panel. The asterisks (∗) in this panel indicate the second, seventh, eleventh, and eighteenth beats, shown also in panels (c) and (d). In panels (c) and (d) the four lowest QTp with an asterisk correspond to four interval peaks T e. The daggers (†) show the fifth, ninth, and fifteenth beats that vary in line with the three highest QTp values and correspond to the three lowest T e values. This pattern indicates that the two ECG signals oscillate in a substantially coherent manner. Conversely, the RR intervals yield poor coherence (a) with the other intervals studied.
