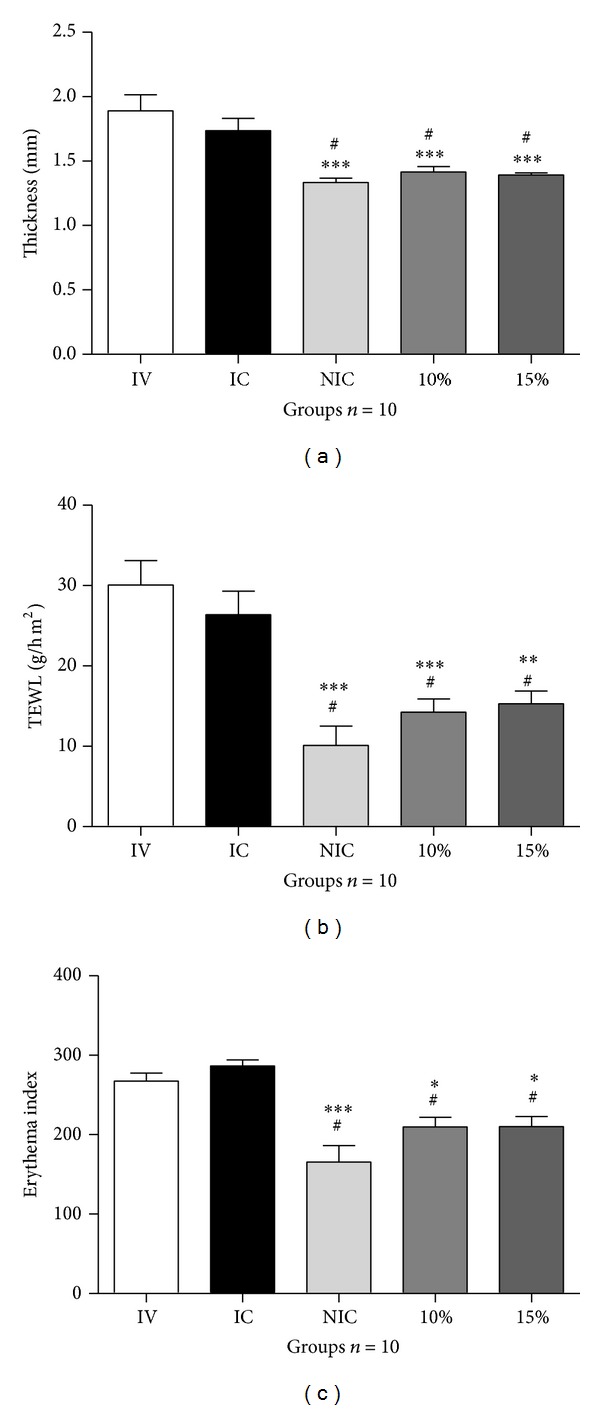
Figure 2.

(a) Thickness values (mm), (b) transepidermal water loss, and (c) erythema obtained for the dorsal areas. IV = irradiated and treated with the vehicle (formulation 0%). IC = irradiated control (the group was irradiated but did not receive any topical treatment). NIC = nonirradiated control (the group was not irradiated and did not receive any topical treatment). 10% = group irradiated and treated with the formulation 10%. 15% = group irradiated and treated with the formulation 15%. The values were obtained before (baseline values) and 20 h after UV exposure during 7 days of treatment. (n = 10 mice). # P < 0.05 versus IC. ∗ P < 0.05, ∗∗ P < 0.01, and ∗∗∗ P < 0.001 versus IV. ANOVA, followed by Tukey's test. Data represents mean ± SEM.
