
Figure 9.
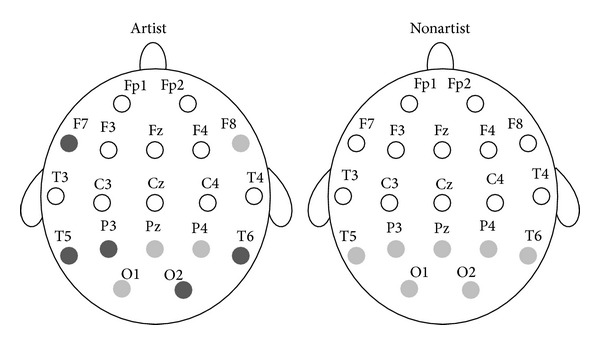
Statistically significant differences in ApEn for the two groups during the visual perception and the mental imagery. Light gray circles, P < 0.05. Dark gray circles, P < 0.01. Black circles, P < 0.001.
Official websites use .gov
A
.gov website belongs to an official
government organization in the United States.
Secure .gov websites use HTTPS
A lock (
) or https:// means you've safely
connected to the .gov website. Share sensitive
information only on official, secure websites.
Statistically significant differences in ApEn for the two groups during the visual perception and the mental imagery. Light gray circles, P < 0.05. Dark gray circles, P < 0.01. Black circles, P < 0.001.