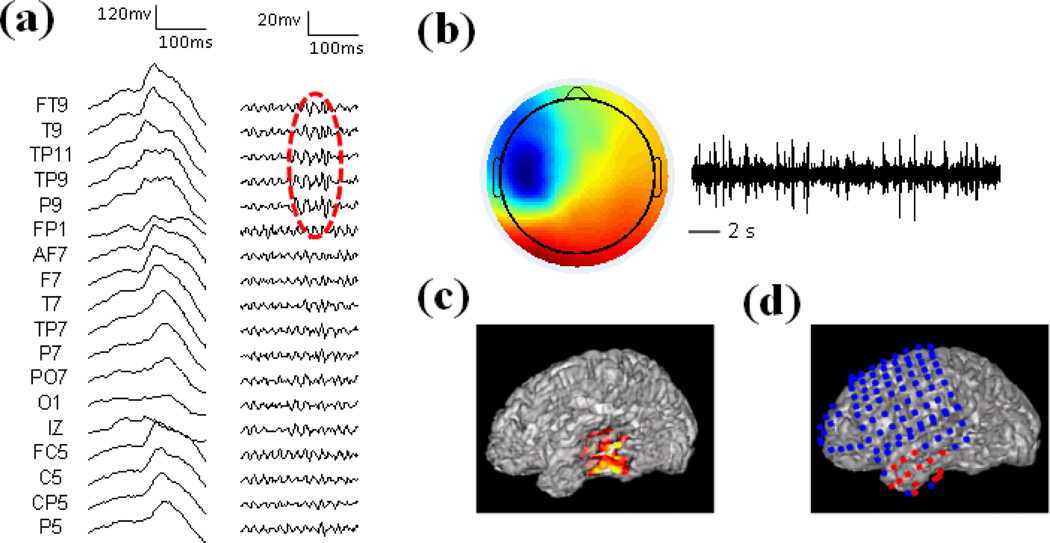
Fig. 5.
Results in Patient 5. (a) Left: Raw EEG; Right: High-pass filtered EEG above 30 Hz. HF activity is marked with red circle. (b) Spatial map and temporal activation of one HF component. (c) Source imaging results of HF activity. (d) Seizure onset zone of intracranial recording is highlighted with red dots.

