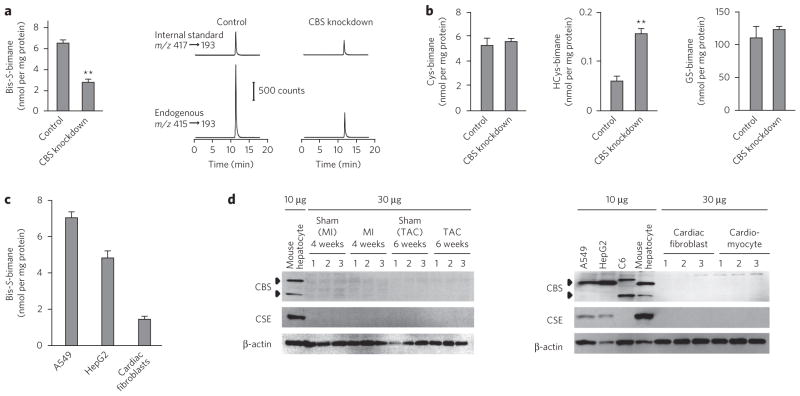
Figure 4. Cellular HS− formation and its physiological relevance to electrophile metabolism.
(a) Quantification by LC-ESI-MS/MS coupled with a monobromobimane-based assay of HS− formed by A549 cells treated with CBS siRNA or untreated cells. Data represent mean ± s.d. (n = 3). **P < 0.01. CBS knockdown was confirmed by western blot (Supplementary Fig. 7b). (b) Quantification of low-molecular-weight thiols in A549 cells with and without CBS knockdown. Data represent mean ± s.d. (n = 3). **P < 0.01. GS-bimane, glutathione-bimane. (c) Comparison of HS− production in cultured cells. Data represent mean ± s.d. (n = 3). (d) Western blots for expression of CBS and CSE in various cultured cells and rat cardiac cells. Mouse cardiac tissues were analyzed 4 weeks after sham operation or myocardial infarction or 6 weeks after sham operation or TAC (top). Cultured cells (A549, HepG2, C6, mouse hepatocytes) and rat cardiac fibroblasts and myocytes were analyzed for expression of CBS and CSE. Uncropped blots are shown in Supplementary Figure 18.

