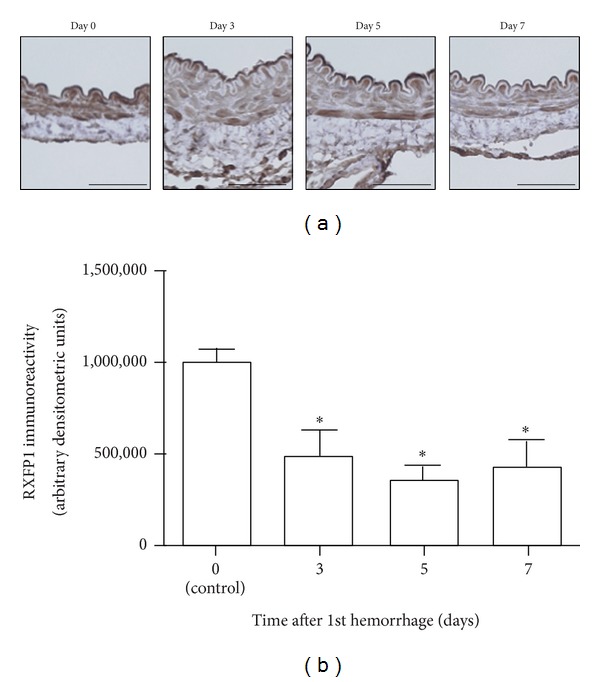
Figure 4.

Time course of changes in RXFP1 expression in the rabbit basilar artery after subarachnoid hemorrhage (SAH). (a) Representative images of immunohistochemical staining for RXFP1 on cross sections of rabbit basilar arteries after SAH (scale bars, 50 μm). (b) A summary of densitometric analysis of immunohistochemical staining for RXFP1. Data are the means ± SEM (n = 3 per group). *P < 0.05 versus day 0 (control).
