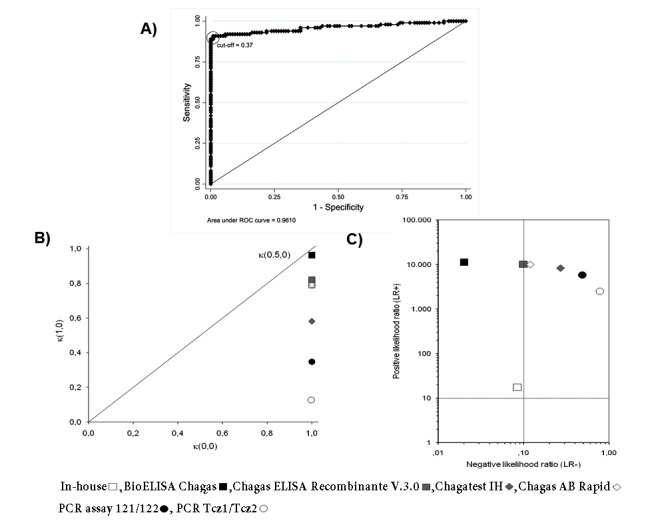
Figure 1. Analysis of diagnostic tests to detect Trypanosoma cruzi infection in patients with chronic Chagas disease. A) ROC curve of in-house ELISA. It shows the analysis of sensitivity and specificity at different cut-off values of in-house ELISA compared with the diagnosis of Chagas disease by clinical (electrocardiogram, echocardiogram and 24-h Holter), epidemiological evaluation and laboratory findings. B) Quality of sensitivity, specificity, and efficiency of each serological and molecular diagnostic tests. The optimum would be a test with values at the top right and on diagonal. κ(1,0) = quality of sensitivity, κ(0,0) = quality of specificity, κ(0.5,0) = quality of efficiency. C) Positive Likelihood ratio (LR+) and negative Likelihood ratio (LR-) of each serological and molecular diagnostic test. Test in right upper quadrant only confirms the diagnosis and in left lower quadrant only excludes the diagnosis. The optimum would be a test in the left upper quadrant because it confirms and excludes the diagnosis.

