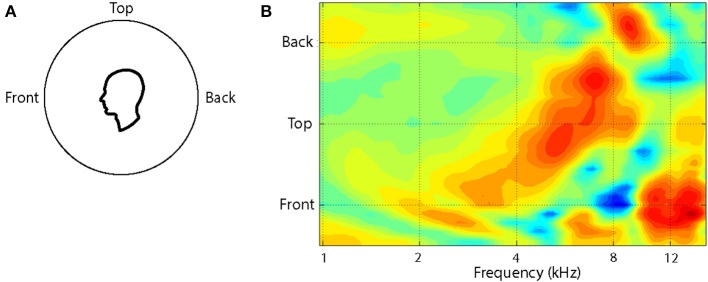
Figure 2.

The variation in the HRTF is shown as a function of location along a cone of confusion on the midline for the left ear of one subject (A). The HRTFs have been recorded at roughly 10° intervals and interpolated to provide the surface plot (B). Recordings were not done for locations greater than 45° below the audio-visual horizon. The colors of the contours indicate the amplitude of the function at each frequency, location conjunction and extend from 12 dB (dark red) to −15 dB (dark blue).
