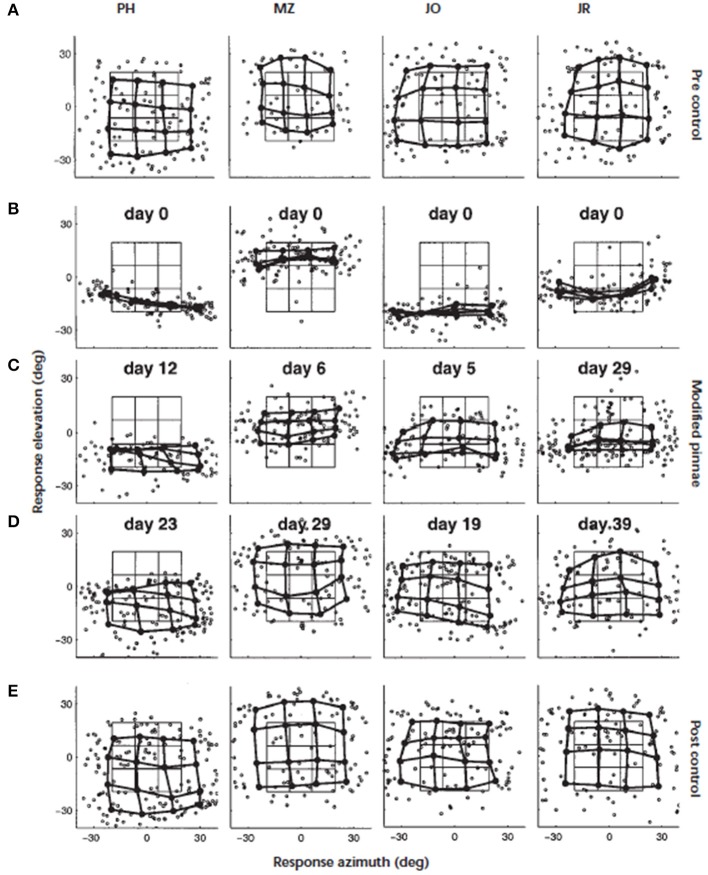
Figure 3.
Adaptation to altered spectral cues. Localization behavior of four subjects (from left to right) before, during, and immediately after the adaptation period. Day 0 marks the start of the adaptation experiment. The panels show, for each subject, the individual saccade vector endpoints in the azimuth–elevation plane (symbol °). In addition, the saccade vectors were also averaged for targets belonging to similar directions by dividing the target space into 16 half-overlapping sectors. Averaged data points (solid circle) from neighboring stimulus sectors are connected by thick lines. In this way, a regular response matrix indicates that the subject's saccade endpoints capture the actual spatial distribution of the applied target positions. The target matrix, computed in the same way as the saccade matrix, has been included for comparison (thin lines). (A) Results of the preadaptation control experiment on day 0, immediately preceding the application of the molds. (B) Localization responses immediately after inserting the molds (day 0). Note the dramatic deficit in elevation responses for all subjects. (C) Results during the adaptation period after 12 (PH), six (MZ), five (JO), and 29 (JR) days of continuously wearing the ear molds. (D) Results near the end of the adaptation period. Stable and reasonably accurate localization behavior has been established in all subjects. (E) Results of the control condition, immediately after removal of the molds. All subjects localized sounds with their original ears equally well as before the start of the experiment several weeks earlier. Figure 2 from Hofman et al. (1998).

