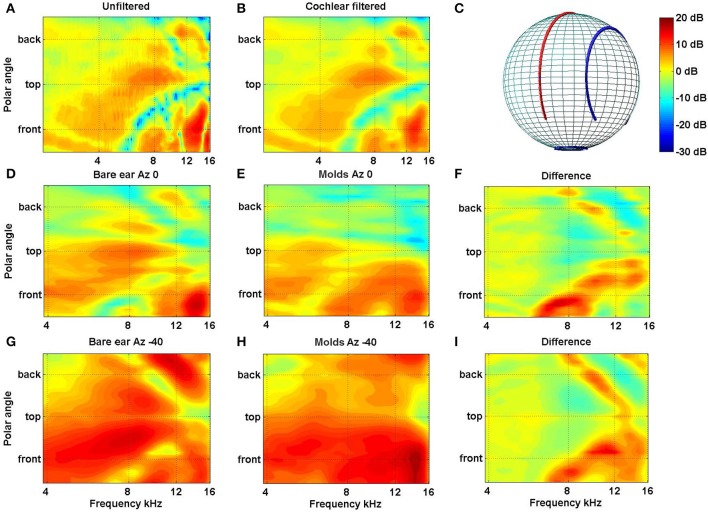
Figure 4.
(A) Filter functions of the left ear of one subject are plotted for the midline cone of confusion before and (B) after passing through a cochlear filter model. The features in (B) indicate that, despite the frequency filtering and spectral smoothing produced by the cochlear, substantial spectral features are preserved within the auditory nervous system. Filter functions for the left ear of a different subject are plotted for the midline [D–F: Azimuth 0°, cf. red line in (C)] and 40° off the midline [G–I: Azimuth −40°; cf. blue line in (C)] are plotted without molds (D,G) and with molds (E,H). The data have been smoothed, as above, using the cochlear filter model. The differences between the bare ear and mold conditions for both lateral angles are plotted in (F,I) (Data from Carlile and Blackman, 2013).

