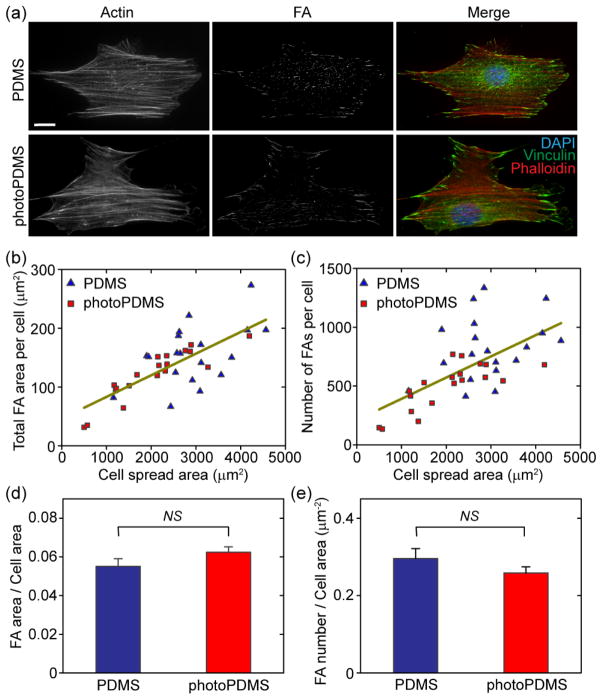
Figure 2.
Evaluation of cytotoxic effect of photoPDMS on cell morphology and FA formation of NIH/3T3 fibroblasts. (a) Representative immunofluorescence images showing single NIH/3T3 fibroblasts plated on 1:10 PDMS (top) and 1:10 photoPDMS (bottom; UV light exposure time: 0 min) surfaces. Both PDMS and photoPDMS were baked at 110°C for 40 hr. Scale bar, 20 μm. Cells were co-stained for nuclei (DAPI; blue), actin (red), and vinculin (green). (b&c) Quantitative and correlative analysis of cell morphology and FA formation of NIH/3T3 fibroblasts. b & c show the total FA area per cell (b) and the number of FAs per cell (c) as a function of cell spread area. Each data point in b & c represents an individual cell plated on either PDMS or photoPDMS substrates as indicated. Data trends in b & c were plotted using linear least square fitting. Cell number n = 19, for both PDMS and photoPDMS substrates. (d&e) Bar plots showing the total FA area per cell area (d) and the FA number per cell area for single NIH/3T3 fibroblasts plated on the PDMS and photoPDMS substrates. Data represents the means ± standard error of mean (s.e.m) from 3 independent experiments. NS, statistically not significant (p > 0.05).

