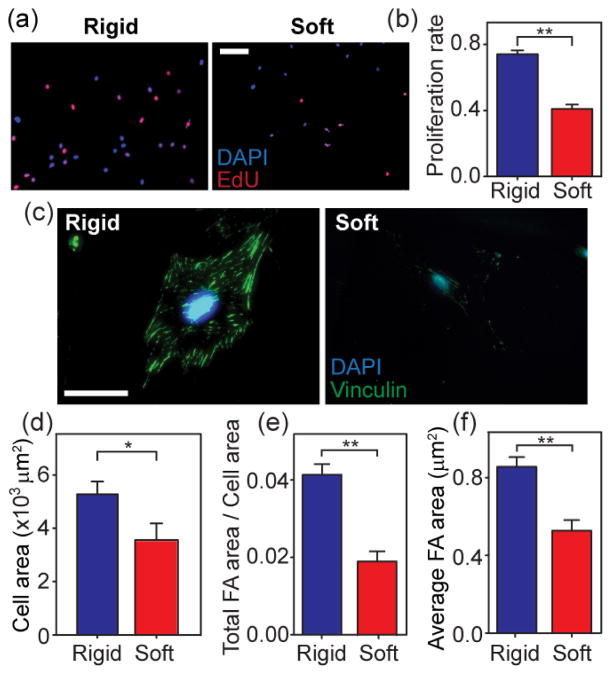
Figure 3.
Effect of the bulk Young’s Modulus E of photoPDMS on cell morphology, FA formation, and proliferation of NIH/3T3 fibroblasts. (a) Representative immunofluorescence images of NIH/3T3 fibroblasts co-stained with DAPI (blue) and EdU (pink) after 8 hr of culture on flat photoPDMS substrates of different rigidities. Rigid photoPDMS substrate, E = 2.48 MPa. Soft photoPDMS substrate, E = 0.027 MPa. (b) Proliferation rate of NIH/3T3 cells after 8 hr of culture as a function of E of photoPDMS substrates. Data represents the means ± s.e.m from 3 independent experiments. **, p < 0.01. (c) Representative immunofluorescence images of single NIH/3T3 fibroblasts on flat photoPDMS substrates of different rigidities after 24 hr of culture. Cells were co-stained for nuclei (DAPI; blue) and vinculin (green). (d–f) Bar plots showing cell spread area (d), total FA area per cell area (e), and average FA area for single NIH/3T3 fibroblasts plated on flat photoPDMS substrates of different rigidities after 24 hr of culture. Data represents the means ± s.e.m from 3 independent experiments. n = 32 for 1:10 photoPDMS, and n =30 for 1:30 photoPDM S. *, p < 0.05. **, p < 0.01.

