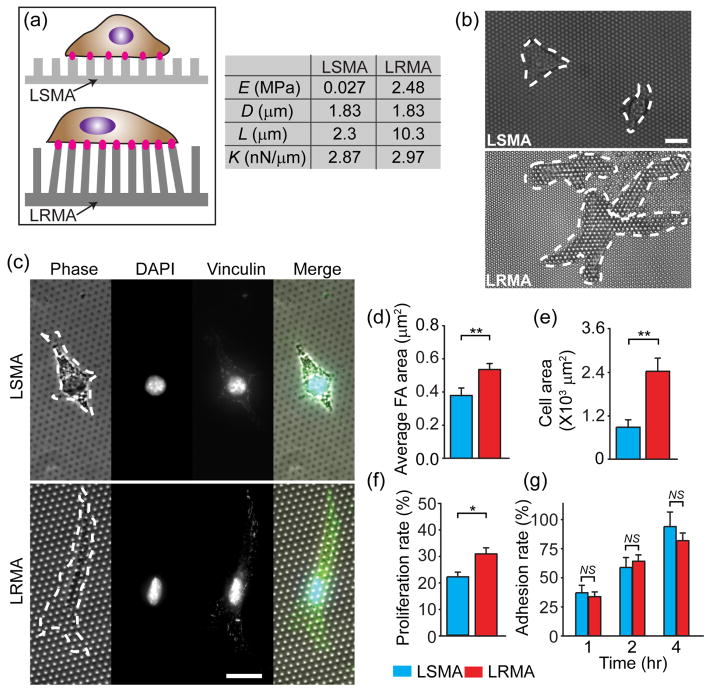
Figure 4.
Mechanoresponsive cellular behaviors depending on local rigidity sensing on the photoPDMS micropost array. (a) Schematic showing NIH/3T3 cells adhered on the photoPDMS micropost arrays generated using soft (top; E = 0.027 MPa) and rigid (bottom; E = 2.48 MPa) photoPDMS (LSMA: “local soft micropost array”; LRMA: “local rigid micropost array”). The spring constant K were comparable between LSMA and LRMA. (b&c) Representative phase-contrast and immunofluorescence micrographs of NIH/3T3 cells spreading on LSMA and LRMA after 24 hr of culture. White dashed lines in micrographs highlight cell boundaries. Cells in c were co-stained for nuclei (DAPI) and vinculin. Scale bar: 20 μm. (d&e) Bar plots showing the average FA area (d) and the cell spread area (e) of single NIH/3T3 fibroblasts plated on LSMA and LRMA after 24 hr of culture. Data represents the means ± s.e.m from 3 independent experiments. n = 20 for both LSMA and LRMA. **, p < 0.01. (f) Proliferation rate of single NIH/3T3 fibroblasts plated on LSMA and LRMA. Data represents the means ± s.e.m from 3 independent experiments. *, p < 0.05. (g) Adhesion rate of single NIH/3T3 fibroblasts plated on LSMA and LRMA at different time points as indicated. Data represents the means ± s.e.m from 3 independent experiments. NS, statistically not significant (p > 0.05).

