Fig. 2.
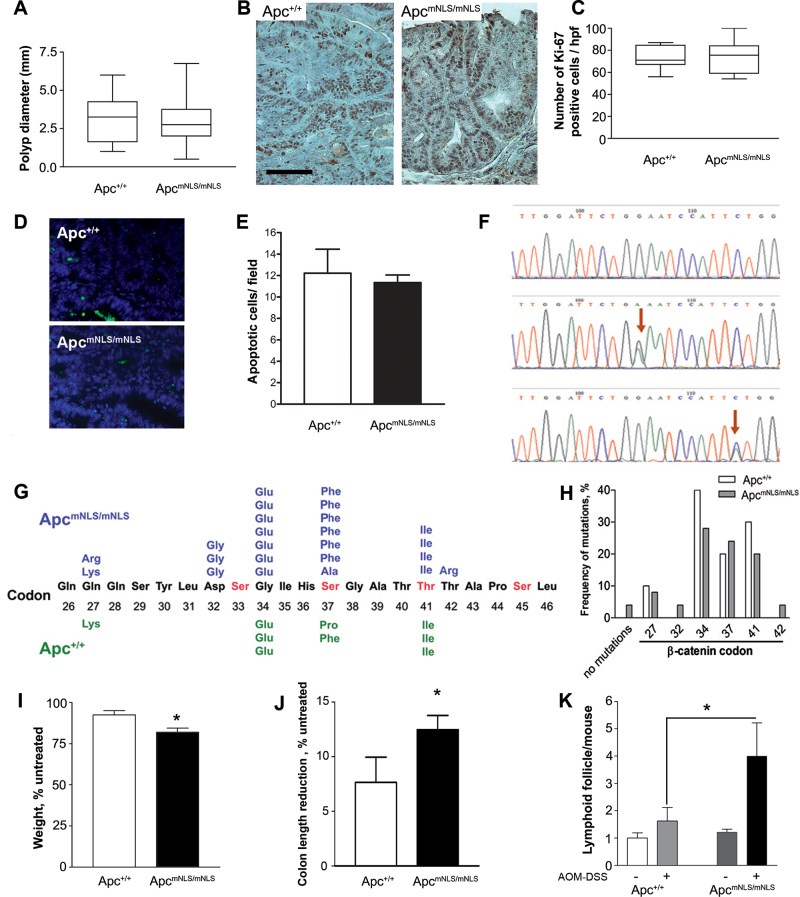
Polyps from AOM–DSS-treated ApcmNLS/mNLS mice do not differ in size, proliferation, apoptosis or β-catenin mutations, but treated ApcmNLS/mNLS mice are more prone to chronic inflammation. (A) Colon polyp diameters from AOM–DSS-treated ApcmNLS/mNLS and Apc+/+ mice presented as box and whiskers plots. (B) Representative images of Ki-67 staining, scale bar = 100 µm. (C) Box and whiskers plots of proliferation marker Ki-67-positive cells per 100×100 µm high-power field (hpf) from AOM–DSS-treated ApcmNLS/mNLS and Apc+/+ mice. (D) Representative images of TUNEL assay showing apoptotic cells in green and 4′,6-diamidino-2-phenylindole (DAPI)-stained nuclei in blue. (E) The average number of apoptotic cells per high-power field (×40) in tumors from AOM–DSS-treated Apc+/+ (upper panel) and ApcmNLS/mNLS (lower panel) mice. (F) Representative sequencing chromatographs showing a G→A (middle) or a C→T (lower) mutation (arrows) or the normal control β-catenin coding sequence (top). (G) Predicted amino acid alterations resulting from the missense mutations in exon 3 of β-catenin are presented for polyps from AOM–DSS-treated ApcmNLS/mNLS (top) and Apc+/+ (bottom) mice. (H) The distribution of β-catenin exon 3 mutations found in tumors from ApcmNLS/mNLS and Apc+/+ mice is displayed as the relative frequency at each codon. (I) The average weight change of AOM–DSS-treated mice is shown relative to the untreated mice from both ApcmNLS/mNLS and Apc+/+ groups (*P < 0.01, Student’s t-test). (J) The average reduction of colon length in AOM–DSS-treated mice as a percentage to the untreated mice (*P < 0.05, Student’s t-test). (K) The average number of visible colonic lymphoid follicles in untreated and AOM–DSS-treated mice (*P < 0.05, Student’s t-test). Error bars represent standard error of the mean throughout.

