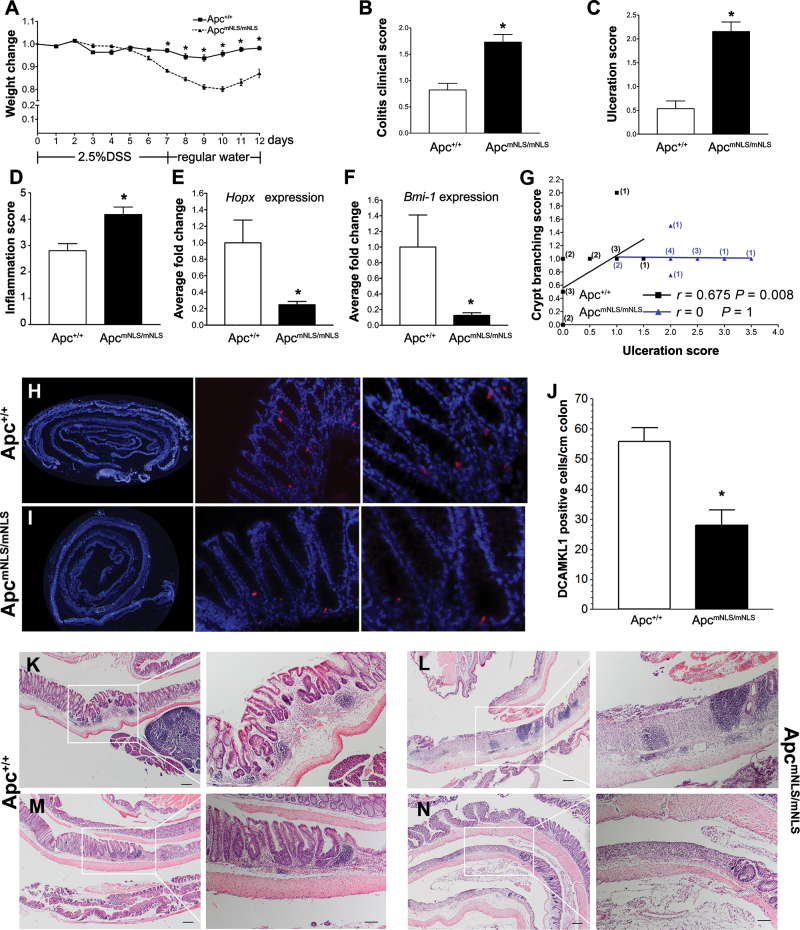
Fig. 3.
DSS induces more severe tissue damage and less effective tissue repair in ApcmNLS/mNLS mice. (A) Weight changes in 2.5% DSS-treated ApcmNLS/mNLS and Apc+/+ mice (treatment schematic shown below graph). * indicates P < 0.05, using Student’s t-test. (B) The average colitis severity clinical score in DSS-treated ApcmNLS/mNLS and Apc+/+ mice (P < 0.05, using Mann–Whitney test). (C and D) Histopathological scoring for ulceration (C) and inflammation (D) in DSS-treated ApcmNLS/mNLS and Apc+/+ mice (P < 0.05, using Mann–Whitney test). (E and F) Relative expression of the intestinal stem cell markers; Hopx (E) and Bmi1 (F) in DSS-treated Apc+/+ and ApcmNLS/mNLS mice (P < 0.05, using Mann–Whitney test). (G) Correlation between ulceration score and crypt branching score in 14 DSS-treated Apc+/+ (black squares) and 13 treated ApcmNLS/mNLS mice (blue triangles). The number of mice at each point are presented in black (Apc+/+) and blue (ApcmNLS/mNLS). (H–J) Intestinal stem cell marker DCAMKL (red) in colons from DSS-treated Apc+/+ (H) and ApcmNLS/mNLS (I) mice. The average number of positive cells/cm of colon from DSS-treated mice is presented in (J) (P < 0.05, Student’s t-test). (K–N) Representative pictures of colonic lesions from DSS-treated Apc+/+ mice (K and M) and treated ApcmNLS/mNLS mice (L and N) showing inflammation with no ulceration and lymphocytic infiltration (K), ulceration with lymphocytic infiltrations (L), crypt branching (M) and ulceration (N). Scale bars 200 µm (left panels) and 100 µm (right panels).

