
FIGURE 2.
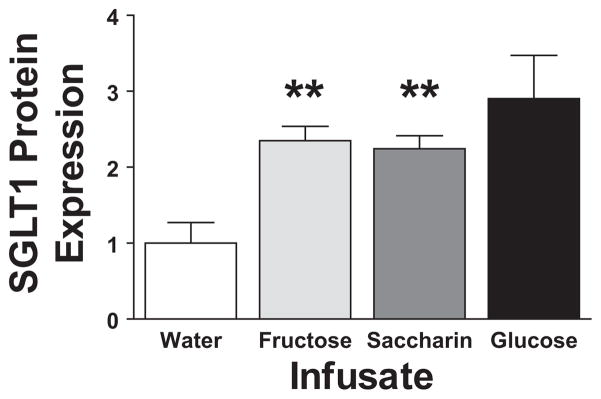
SGLT1 Western blot results are shown for whole bowel infusions of 250 mM D-fructose and 0.3% saccharin compared with infusions with water. Results for each show relative SGLT1 expression (as measured by densitometry) compared with water infusion (**P < 0.01 compared with water). Results from infusion of D-glucose are presented for comparison.