
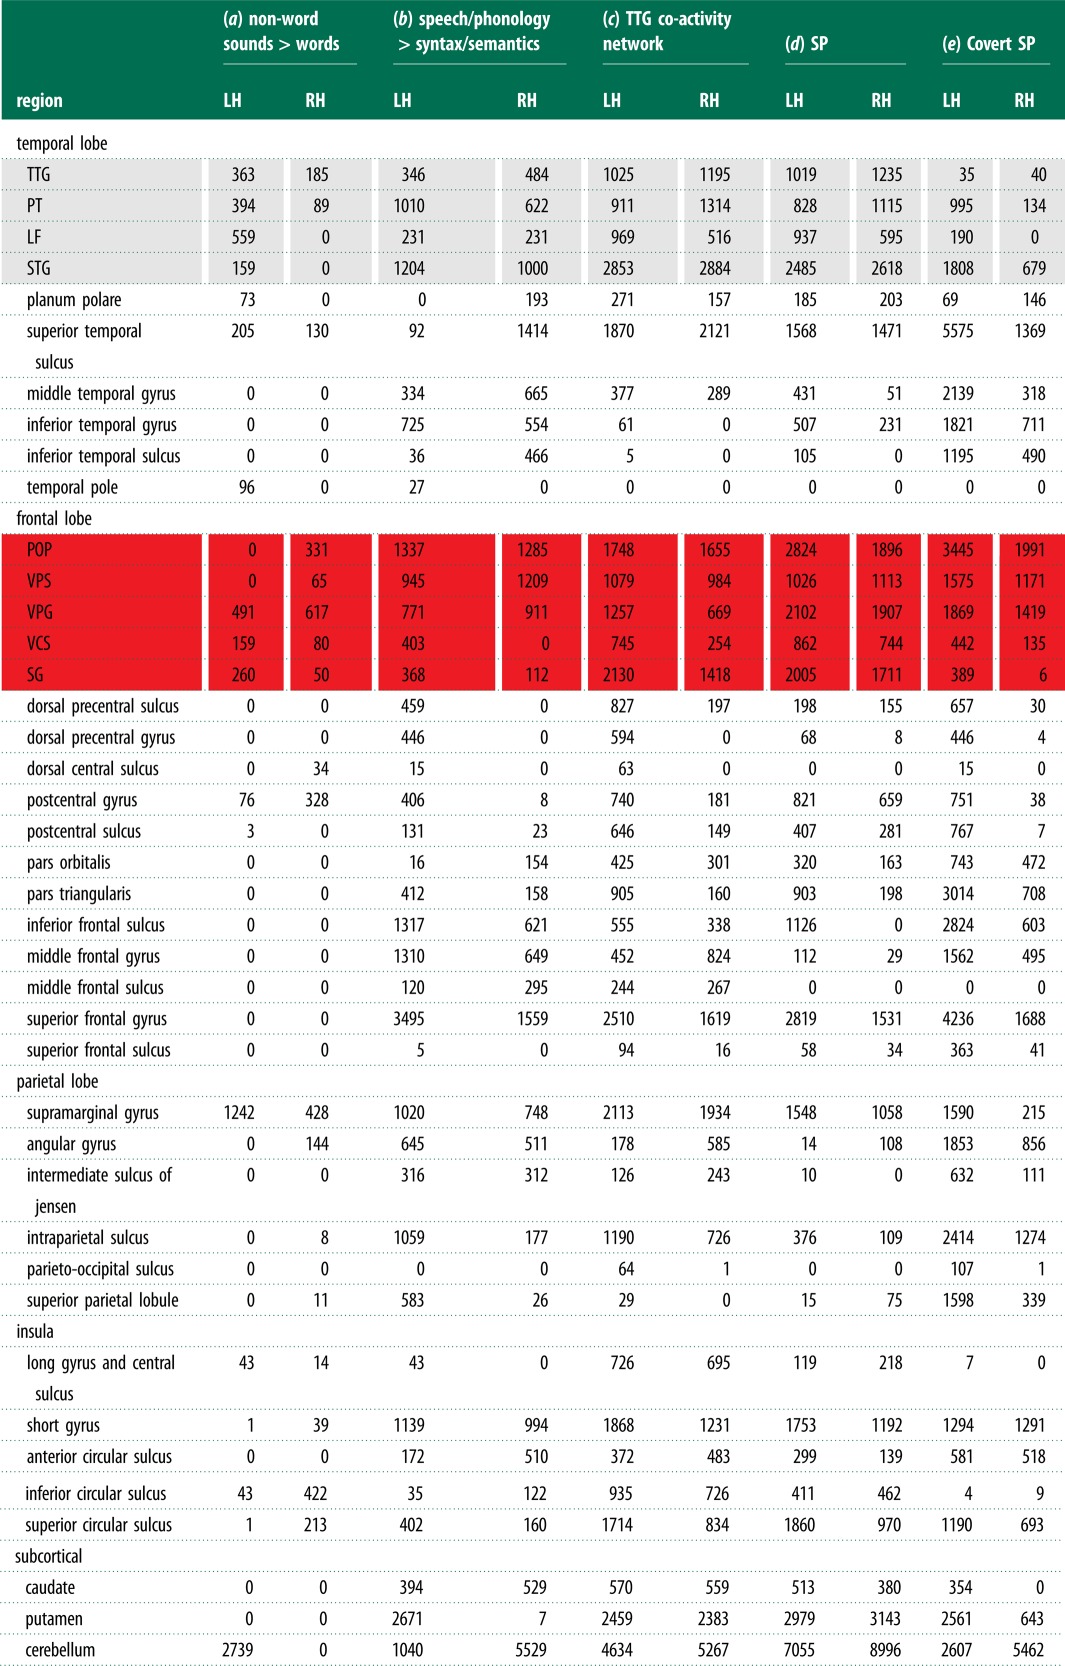
Table 1.
Meta-analyses of activity by region. (Volume of activation in grey matter per region in mm3. Grey and red outlines correspond the PST and PVF regions in figure 1a, where region abbreviations are defined. LH and RH are left and right hemispheres, respectively. Online version in colour.)
 |