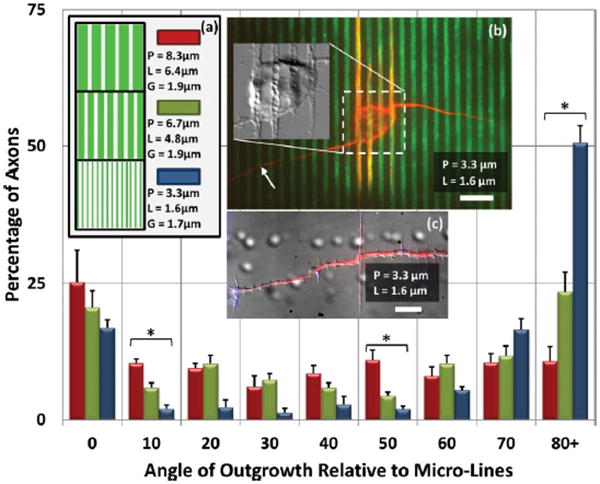
Fig. 3.

Axonal Orientation on Micro-Lines of Constant G, Varying L (a) In these data, L is varied by applying differential force across the range of P such that G is now held constant (G = 1.80 ± 0.15 μm). For P = 3.3 μm, L is the minimum dimension achievable. For P = 8.3 μm, axonal growth is generally parallel to the lines, though outgrowth direction is becoming nearly randomized. And similar to Fig. 2, as P is decreased, perpendicular outgrowth increases. When P = 3.3 m, the axon outgrowth is strongly oriented perpendicular to the micro-lines. * indicates p < 0.01 by ANOVA. Error bars: ± SE (b) Neuron on P = 3.3 μm pattern. Arrow indicates the axon. Other neurites (presumed dendrites) mostly prefer to grow along the micro-lines. Note also the increased microtubule presence along the micro-lines in the intra-somatic region. Inset: DIC image of soma reveals an alignment of cellular structure with the micro-lines. (c) An axon on a P = 3.3 m pattern reveals vinculated growth along the axon labeled for actin filaments (blue: phalloidin, red: α-tubulin). Scale bar: 10 μm.
