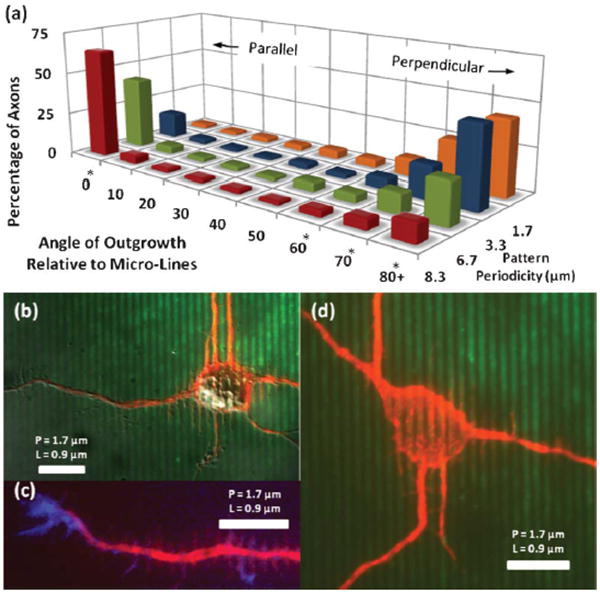
Fig. 6.

Axonal Outgrowth: Varying P, Fixed L/P (a) Directional outgrowth of axons is measured and grouped into 10° bins. The transition from parallel to perpendicular guidance is seen as periodicity (P) decreases, while L/P is held at 0.5. * indicates p < 0.01 for a given orientation by ANOVA. (b–d) Outgrowth on P = 1.67 μm micro-lines. At this scale parallel axonal alignment is all but absent, although microtubules are still seen to align within the soma (d). Perpendicular vinculated growth is very dominant (b, c). All scale bars: 10 μm.
