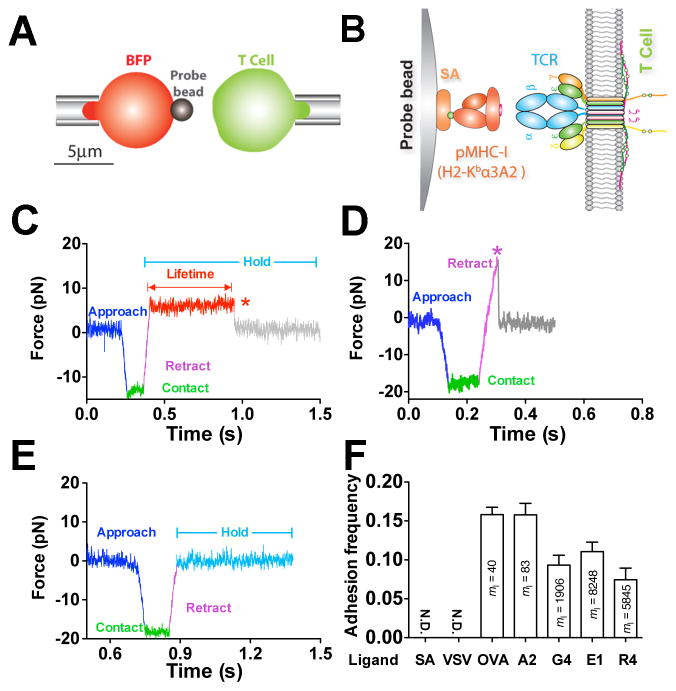
Figure 1. In situ analysis of force-dependent TCR–pMHC bond kinetics by BFP.
(A) BFP schematic. A micropipette-aspirated RBC with a probe bead attached to the apex (left) was aligned against a T cell held by an apposing pipette (right). (B) BFP functionalization. The probe bead was covalently linked to streptavidin (SA) to capture pMHC (left) to interact with TCR (right). (C–E) Representative force traces of measurement cycles showing adhesion that survived ramping and sustained a preset level of force until dissociation (marked by a red star), enabling bond lifetime measurement (C), adhesion ruptured by a ramp force (marked by a magenta star) before reaching the set force or in force-ramp assay (D), or no adhesion (E). (F) Binding specificity. Mean ± s.e.m. of adhesion frequencies of >10 T-cell–bead pairs with 50 contacts for each. Densities of pMHCs (ml) are indicated inside of each bar. N.D. = not detected. See also Figure S1 and Movie S1–S3.

