
Figure 4. TCR- and pMHC-specific Ca2+ flux requires both force and lifetime.
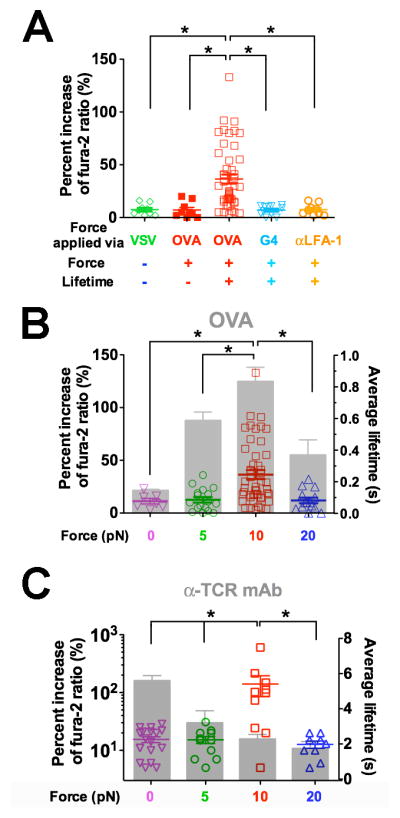
(A) Ca2+ flux requires durable force on TCR bond applied by antigen pMHC. Percent increase of fura-2 ratio in OT1 T cells tested without force or lifetime via VSV (green open diamond, cf. Figure 1E), with force but no lifetime via OVA (red solid square, cf. Figure 1D), or with both force and lifetime (cf. Figure 1C) via OVA (red open square) or G4 (inverted light blue open triangle) or via anti-LFA-1 beads (orange open circle). (B–C) Ca2+ was triggered by an optimal force. Percent increase of fura-2 ratio (points, left ordinate) in OT1 T cells triggered by lifetimes (grey bars, mean ± s.e.m. of >50 measurements, right ordinate) of TCR bonds with OVA (B) or anti-OT1 (C) measured at 0 (inverted magenta open triangle), 5 (green open circle), 10 (red open square), or 20 (blue open triangle) pN force. * denotes p < 0.01 on Ca2+ signals.