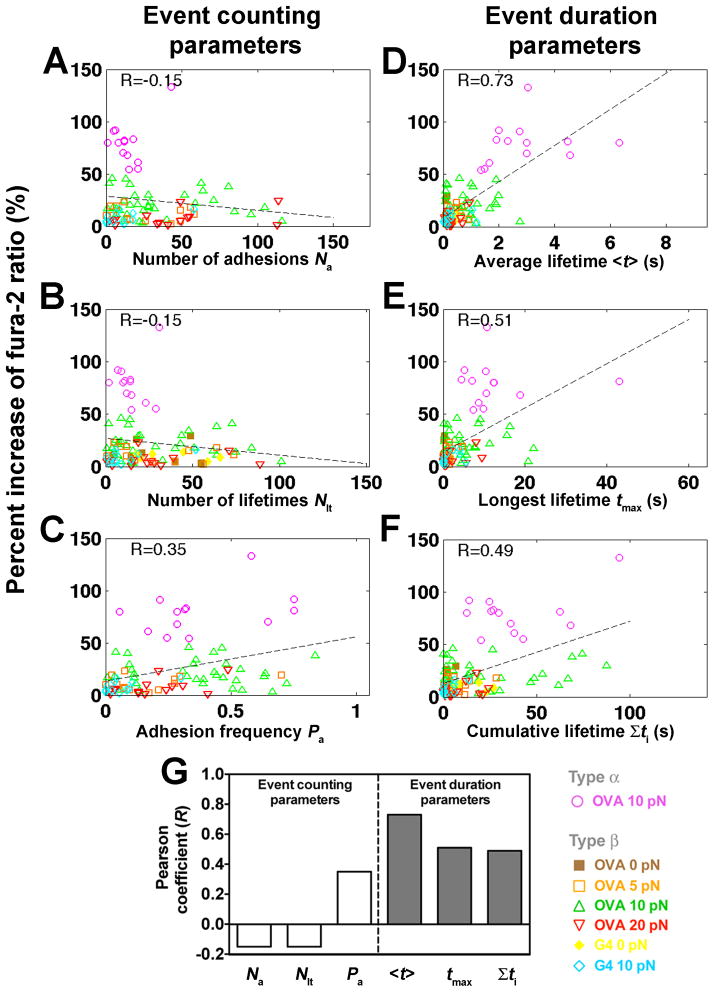
Figure 5. Correlating Ca2+ signals with kinetic-associated statistics from each cell’s 600-s event sequence.
(A–F) Percent increase of fura-2 ratios vs. number of adhesions Na (A), number of lifetimes Nlt (B), adhesion frequency Pa (C), average lifetime <t> (D), longest lifetime tmax (E), and cumulative lifetime Σti (F) of OT1 TCR bonds with OVA at 0 (brown solid square), 5 (orange open square), 10 (magenta open circle or green open triangle, for type α or β Ca2+, respectively) or 20 (inverted open red triangle) pN, or with G4 at 0 (yellow solid diamond) or 10 (light blue open diamond) pN for each T-cell calculated from the binding events in the entire 10-min experimental period. Dashed lines are linear fits to data. The Pearson coefficient of the correlation (R) is indicated in each subpanel. (G) Summary of Pearson coefficients.

