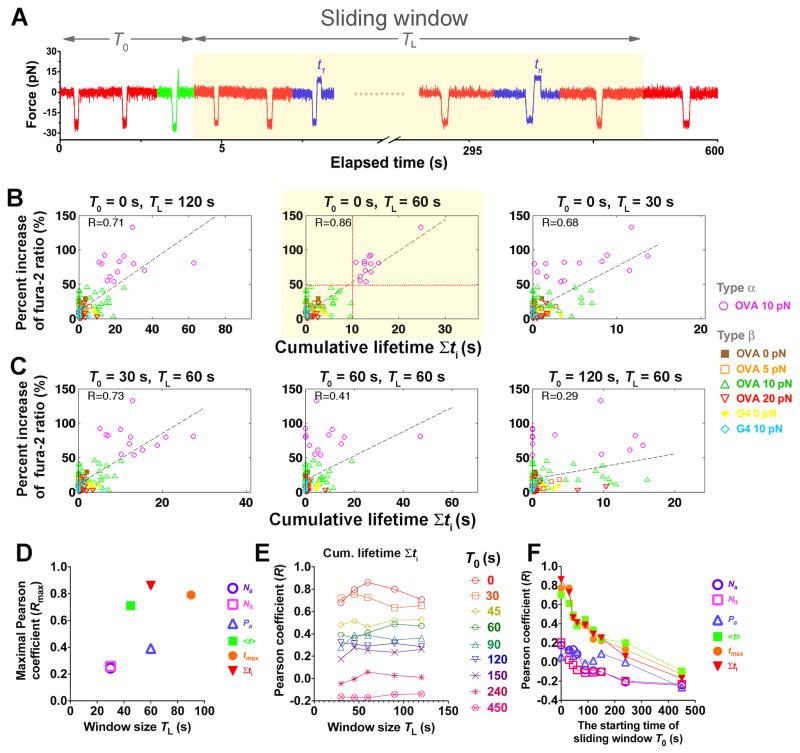
Figure 6. Ca2+ best correlates with TCR–pMHC bond lifetimes accumulated in the first minute of successive force applications.
(A) Schematic of a sliding window (highlighted), starting at T0 with length TL and containing different binding events (red: no adhesion; green: rupture force; blue: lifetime). (B and C) Percent increase of fura-2 ratio vs. cumulative lifetime of OT1 TCR bonds with OVA at 0 (brown solid square), 5 (orange open square), 10 (magenta open circle or green open triangle, for type α or β, respectively) or 20 (inverted open red triangle) pN, or with G4 at 0 (yellow solid diamond) or 10 (light blue open diamond) pN for each T cell accumulated in windows of indicated lengths and starting times. Dashed lines are linear fits to data and the Pearson coefficients (R) are indicated. The horizontal and vertical dotted lines in the subpanel with the best correlation (highlighted) denote the demarcation of types α (magenta open circle) and β (brown solid square, orange open square, green open triangle, inverted open red triangle, yellow solid diamond, light blue open diamond) Ca2+ and the 10-s threshold of cumulative lifetime for triggering type α Ca2+. (D–F) Pearson coefficient analysis to search for the window for the kinetic parameters to achieve the best correlation with Ca2+. (D) Maximal Pearson coefficients Rmax vs. TL of the initial window (T0 = 0) within which the kinetic parameters best correlate with Ca2+. (E) Pearson coefficient for cumulative lifetime vs. sliding window size TL for the indicated starting times T0. (F) Pearson coefficients for indicated kinetic parameters calculated in a 60-s sliding window vs. its starting time T0. Different symbols in (D and F) denote number of adhesions Na (purple open circle), number of lifetimes Nlt (magenta open square), adhesion frequency Pa (blue open triangle), average lifetime <t> (green solid square), longest lifetime tmax (orange solid circle), and cumulative lifetime Σti (inversted red solid triangle).

