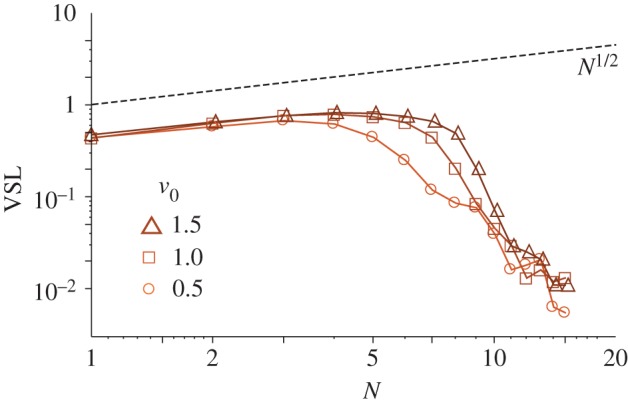
Figure 6.

Log–log plot of the average velocity (VSL) versus aggregate size for various values of propulsion velocity v0. The numerical data are the same as in figure 3f, while the dashed line shows the predicted scaling law VSL ∼ N1/2 in two dimensions. (Online version in colour.)
