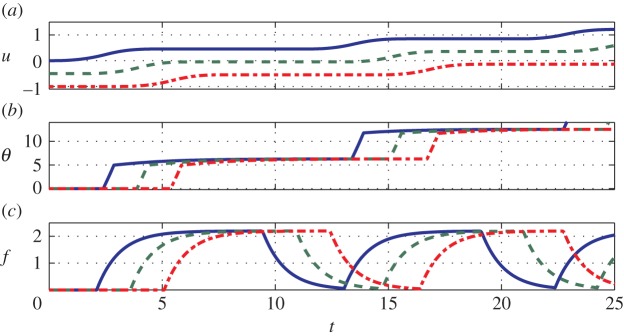
Figure 2.

(a) Displacement u, (b) neuronal activity θ and (c) muscular force f obtained by simulating equations (2.2), (2.4) and (2.5) with F = 1.2, nf = 10, τθ = 2, vI = 21,  , sI = 103, τf = 1, Fmax = 2.2,
  and sJ = 103. We plot only three out of the total number of simulated segments for clarity. See also the electronic supplementary material, movie 2. (Online version in colour.)
