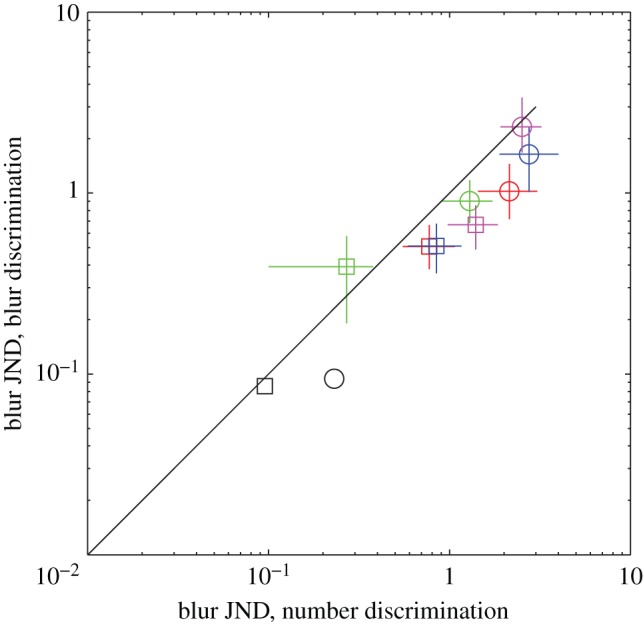
Figure 6.

Just-noticeable differences (JNDs) for blur discrimination (vertical axis) plotted against those for blob number discrimination (horizontal axis), for four different observers (differently coloured symbols). Circles and squares show results for relatively low-frequency standard pedestals and relatively high-frequency stimuli, respectively. The two black symbols show performance of the Watson–Ahumada energy model with the same stimuli as those seen by the human observers.
