
Figure 3.
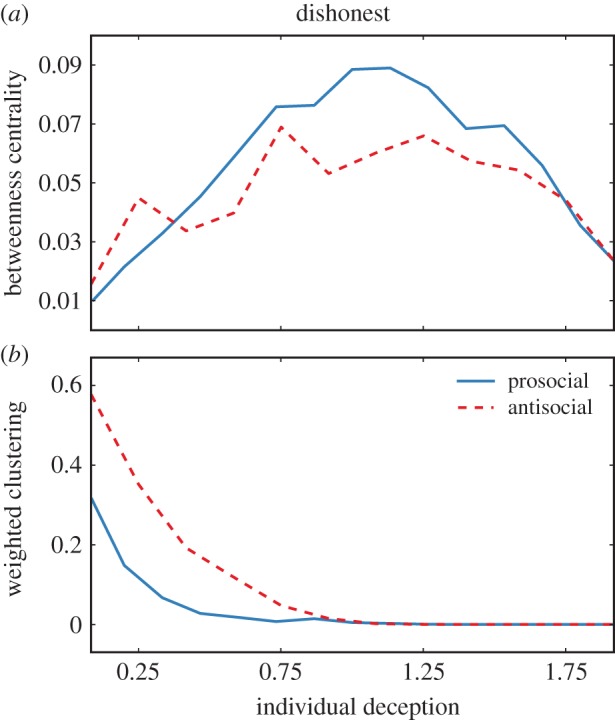
Average effect of individual deception on an agent's (a) betweenness centrality and (b) weighted clustering coefficient, for prosocial (solid line) and antisocial lies (dashed line) and in the case of a dishonest (τ = 0) society. Typically, honesty is related to high clustering, as intermediate deception is to high betweenness centrality values. All curves are averaged over 103 realizations with N = 200,  , dt = 0.002, D = 1 and g = 100. (Online version in colour.)