. 2014 Aug 12;3:e03043. doi: 10.7554/eLife.03043

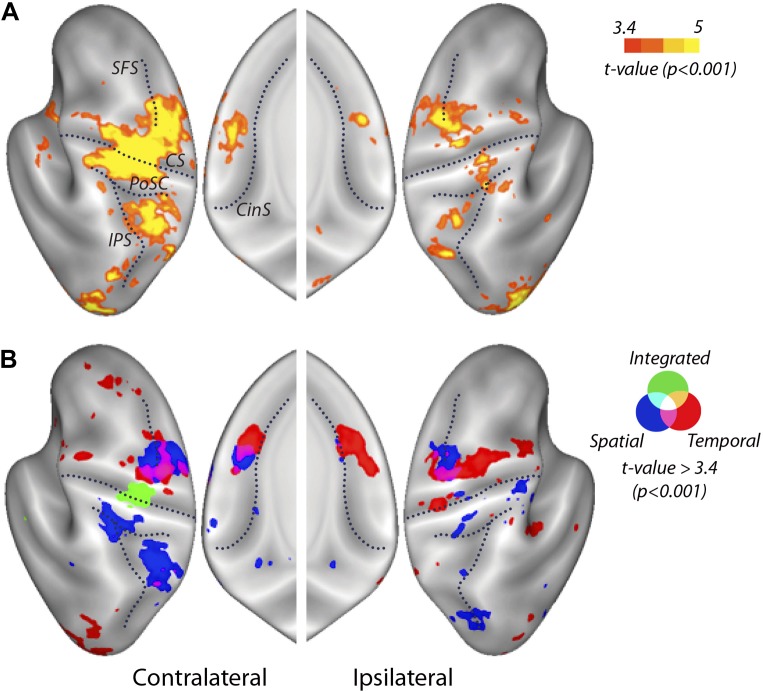
Figure 4. Searchlight classification results shown on an inflated representation of the cortical surface.

(A) Group t-values indicate regions in which the overall classifier performed significantly above chance. (B) Significant group-level above chance classification of spatial (blue), temporal (red), and integrated (green) classifiers. Results are presented at an uncorrected threshold of t(31) > 3.37. p<0.001. CinS, cingulate sulcus; CS, central sulcus; IPS, intraparietal sulcus; PoSC, postcentral sulcus; SFS, superior frontal sulcus.

DOI: http://dx.doi.org/10.7554/eLife.03043.007

Figure 4.

Figure 4—figure supplement 1. Searchlight classification results in the cerebellum.

Figure 4—figure supplement 1.

Yellow scale indicates consistent above chance classification across the group by the overall classifier in ipsilateral Lobules V/VI (Peak t(31) = 5.72, pcluster<0.001, MNI coordinates: 34, −54, −23). Temporal, spatial, and integrated classifiers did not show significant encoding at an uncorrected threshold of t(31) > 3.37, p<0.001.
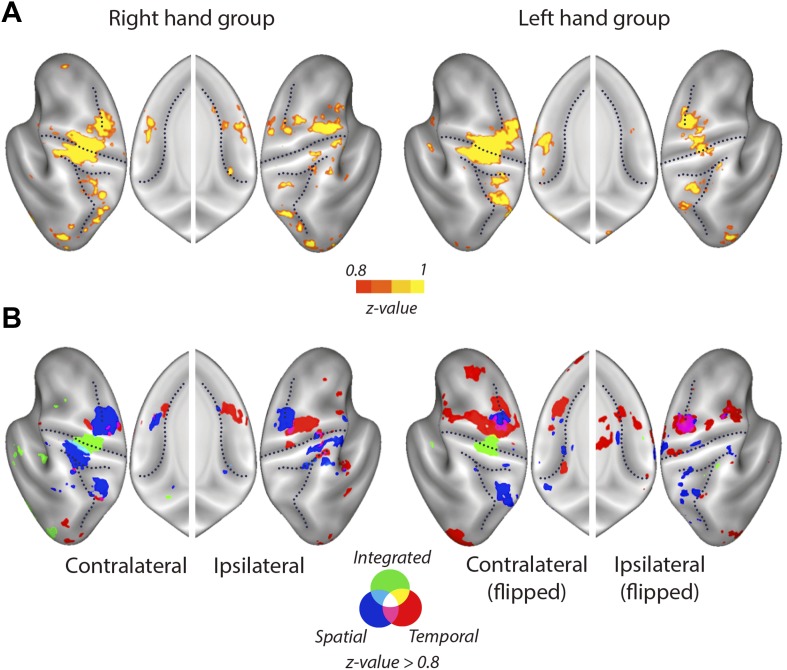
Figure 4—figure supplement 2. Mean searchlight classification accuracy results displayed as in Figure 4, split by group trained on the right and left hand.

Figure 4—figure supplement 2.

(A) Classification accuracy results (z-values). Yellow scale indicates above chance classification by the overall classifier. Results are presented a threshold of z = 0.8 (chance level: z = 0). (B) Blue, red, and green colours stand for above chance classification of spatial, temporal, and integrated patterns, respectively.
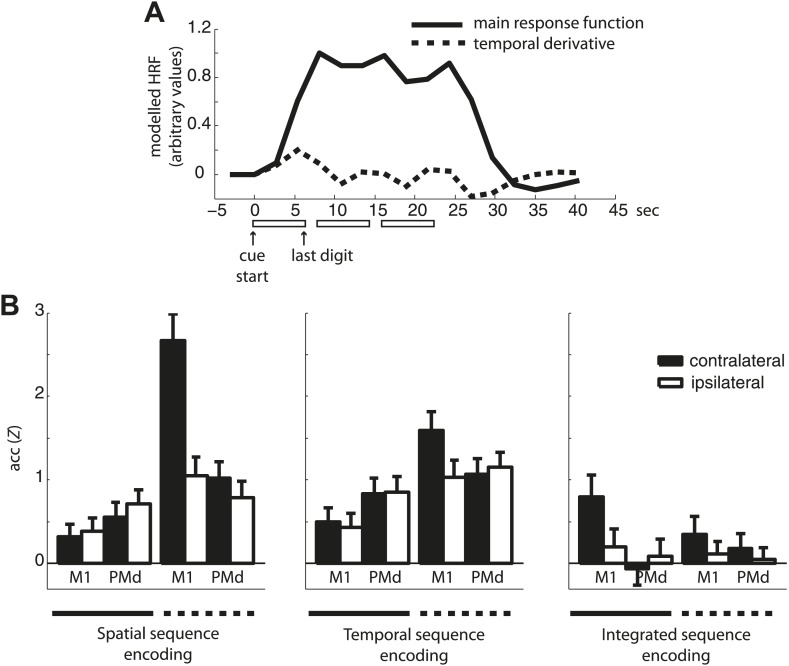
Figure 4—figure supplement 3. Classification accuracy of the main response function and temporal derivative.

Figure 4—figure supplement 3.

(A) An example of the main response function and temporal derivative for three sequence repetitions (one mini-block). Note that in contrast to the temporal derivative that captures the temporal evolution of each sequence by returning to baseline between each sequence, the main response function used in the subsequent classification analysis remains elevated across the three sequence repetitions. (B) Classification accuracy of the main response vs the temporal derivative estimates in contra- and ipsilateral M1 and PMd.
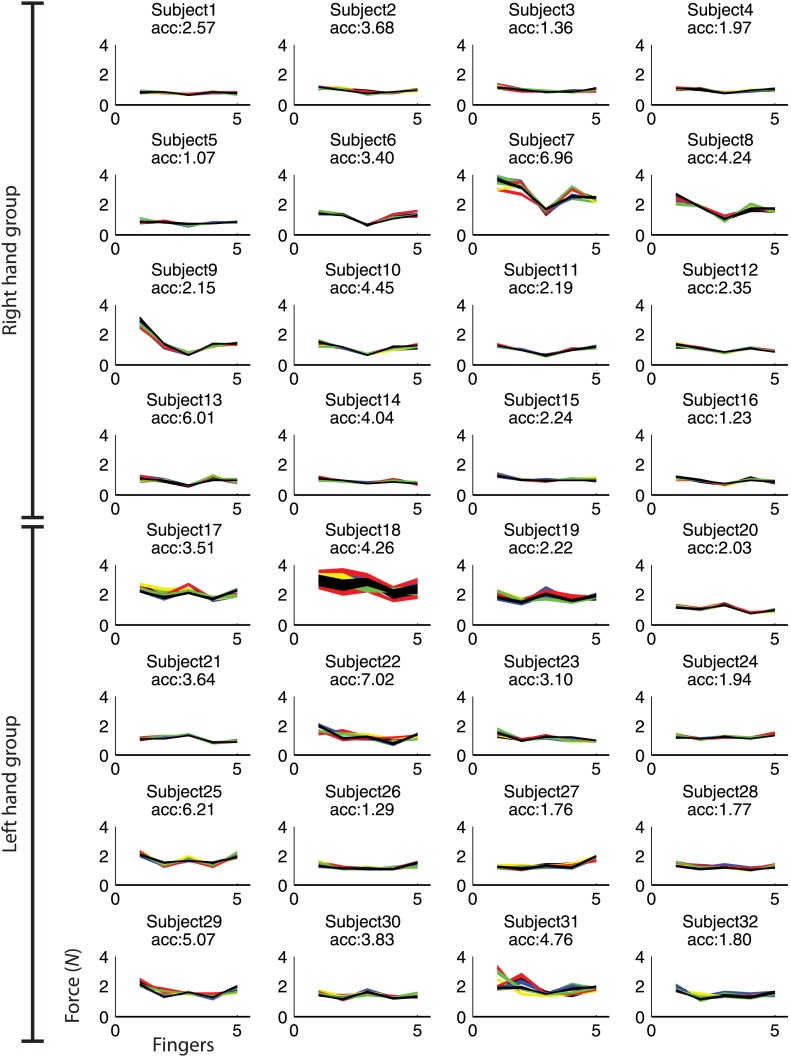
Figure 4—figure supplement 4. Maximum force for finger 1(thumb) to 5 (pinkie) during fMRI.

Figure 4—figure supplement 4.

Each line depicts each participant's mean force across fingers for each of the nine trained sequences. Sequence specific idiosyncratic force profiles could be used to classify the sequences above chance (p<0.001; acc: z-transformed accuracy, chance level = 0).