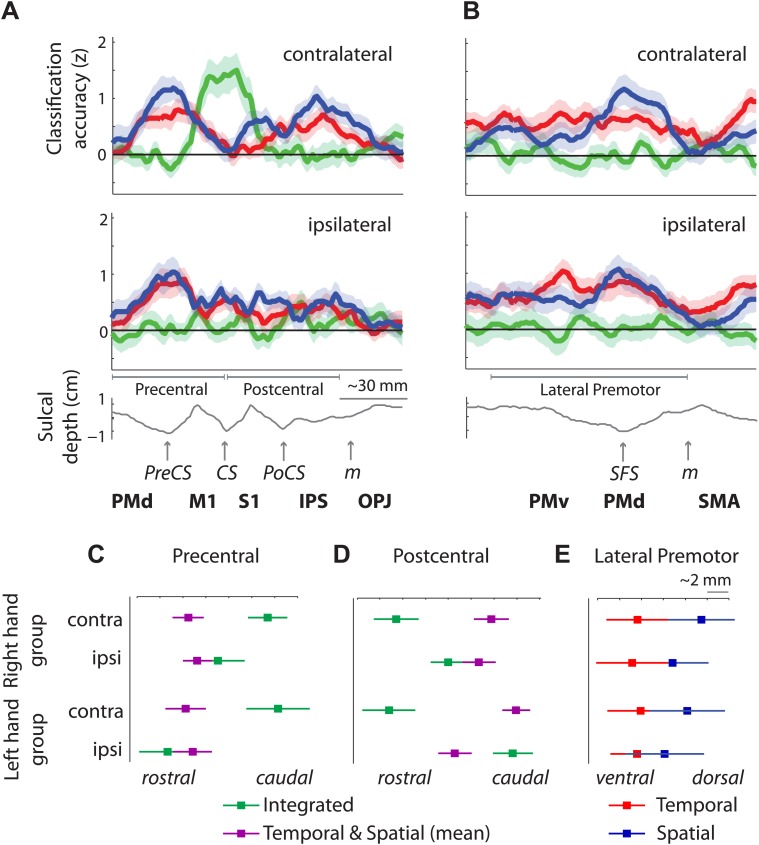
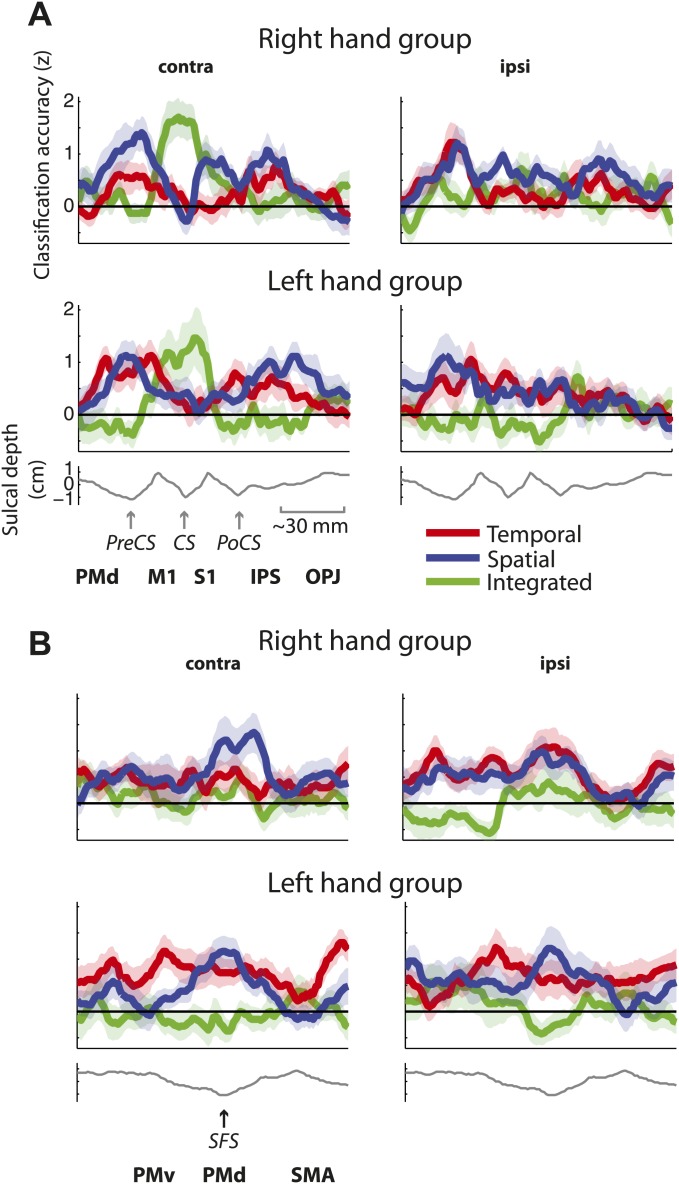
Figure 6. Distribution of encoding in cortical cross-sections.
Shown are profiles of integrated (green), temporal (red), and spatial (blue) classification accuracy (z-values), (A) on a cross-section running from rostral premotor cortex, through the hand area, to the occipito-parietal junction and (B) on a profile running from the ventral, through the dorsal premotor cortex, to the SMA (BA 6). (C) Center of gravity (CoG) analysis across the precentral part (between rostral PMd and central sulcus) of the profile in A shows that independent temporal and spatial classification accuracy (mean in purple) is represented more rostrally to integrated classification accuracy in the contralateral hemisphere across right and left hand groups. (D) CoG analysis across the postcentral part of the profile shows the opposite pattern to C with independent classification accuracy represented more caudally, further away from the CS towards the parietal cortex as compared to integrated classification accuracy. This gradient was found in the contralateral hemisphere across right and left hand groups. (E) CoG analysis across the lateral premotor cortex shows a slight ventral bias for temporal compared to spatial classification accuracy across hemispheres and groups. BA, Brodmann area; CoG, center of gravity; IPS, inferior parietal sulcus; m, medial wall; M1, primary motor cortex; OPJ, occipito-parietal junction; PMd, dorsal premotor cortex; PMv, ventral premotor cortex; PoCS, postcentral sulcus; PreCS, precentral sulcus ventral premotor cortex; S1, primary sensory cortex; SFS, superior frontal sulcus; SMA, supplementary motor area.


