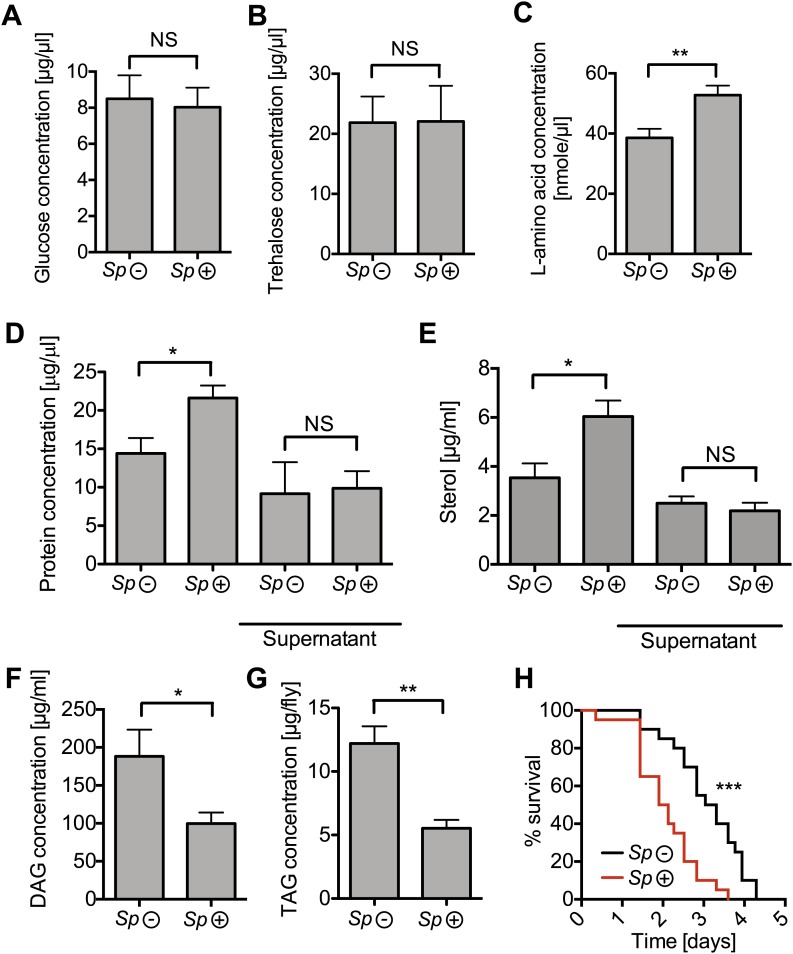
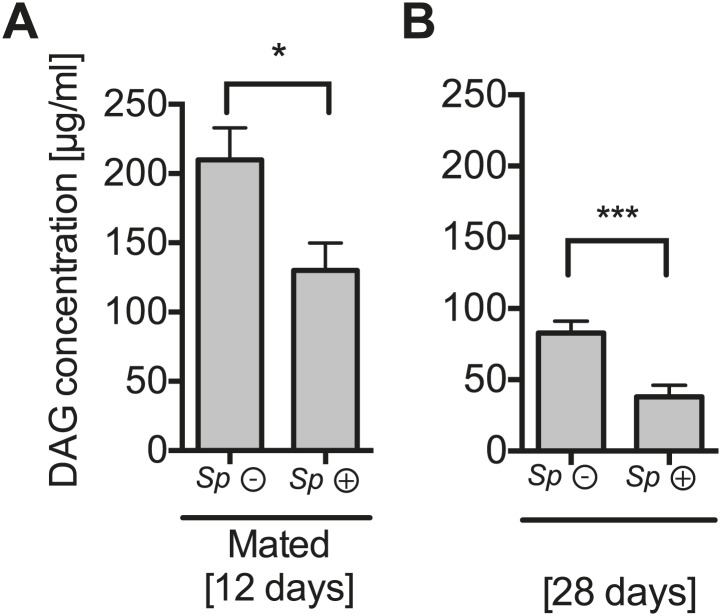
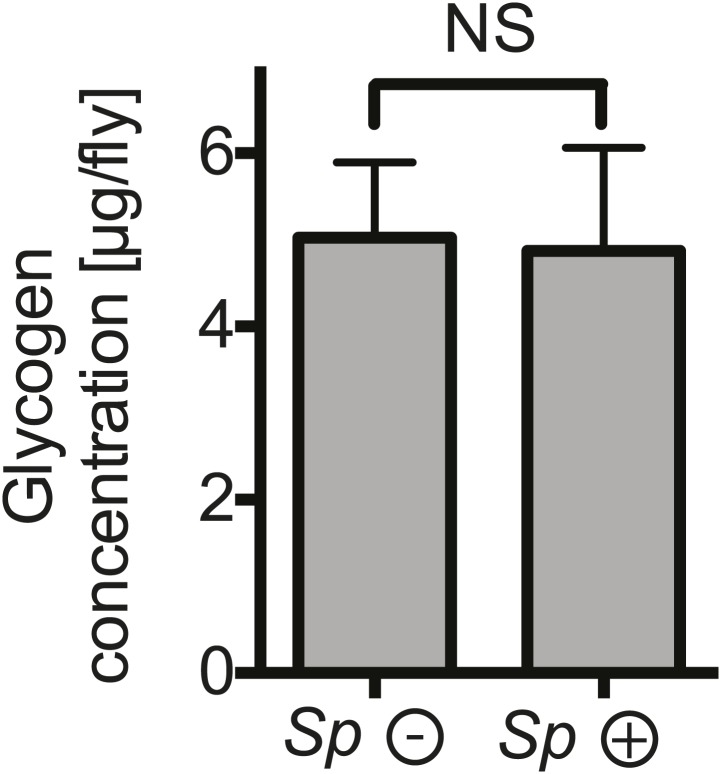
Figure 5. Spiroplasma infection depletes lipids of Drosophila maintained under normal conditions.
Quantification of metabolites in flies that have been maintained on rich media for 12 days. Glucose (A), trehalose (B), and L-amino acid (C) concentration within the hemolymph of uninfected flies (Sp (−)) and Spiroplasma-infected flies (Sp (+)). L-amino acid concentration in the hemolymph is significantly higher in Spiroplasma-infected flies while glucose and trehalose concentrations remain unchanged. Mean ± SEM of three independent experiments is shown, NS (p=0.798 and p=0.977) and **p=0.0056. (D–E) Quantifications of protein (D) and sterol (E) concentration in hemolymph from flies that harbor Spiroplasma (Sp (+)) and uninfected flies (Sp (−)). Hemolymph samples denoted as ‘supernatant’ have been subjected to an additional centrifugation to remove Spiroplasma cells, whereas all other hemolymph samples contain both Spiroplasma cells and hemolymph. Flies-harboring Spiroplasma have significantly higher total levels of protein and sterol in the hemolymph. Mean ± SEM of three independent experiments is shown, *p=0.04 and *p=0.037. After centrifugation to remove bacteria from the hemolymph, there was no longer any significant difference in protein and sterol concentrations between Spiroplasma-infected and uninfected hemolymph. Mean ± SEM of three independent experiments is shown, NS (p=0.881 and p=0.491, respectively). (F) Quantification of DAG content of hemolymph extracts from flies that harbor Spiroplasma (Sp (+)) and flies that do not (Sp (−)). *p=0.0266. Mean ± SEM of three independent experiments is shown. (G) Quantification of whole-fly (reflecting mainly fat body) TAG levels in flies that harbor Spiroplasma (Sp (+)) and uninfected flies (Sp (−)). **p=0.0043. Mean ± SEM of three independent experiments is shown. (H) Survival of flies subjected to an acute starvation after being maintained on rich media for 12 days. Flies-harboring Spiroplasma (Sp (+)) have significantly greater mortality rate than flies that do not harbor Spiroplasma (Sp (−)). ***p<0.0001. N = 20 flies per condition, shown is one representative experiment out of three independent.


