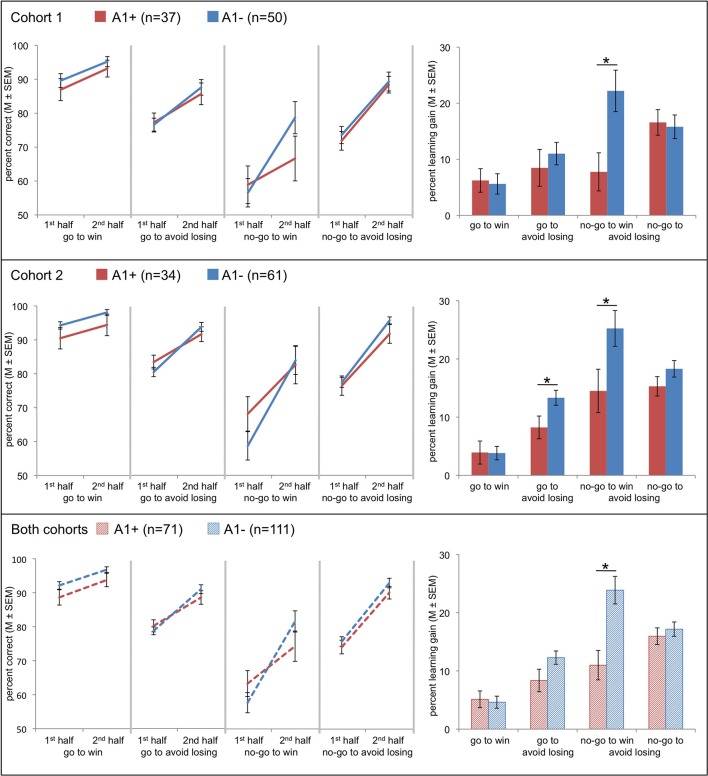
Figure 2.
Effects of Taq1A genotype on choice performance in two independent cohorts and in the entire sample (data of both cohorts combined). Line charts at the left show mean values of correct responses (±s.e.m.) in A1 carriers (red) and A2 homozygotes (blue) in the first and the second half of trials for all four conditions. Bar plots at the right show the differences between mean (±s.e.m.) values of correct responses of second half of trials minus first half of trials in A1 carriers (red) and A2 homozygotes (blue) for each condition. This score represents the four-fold interaction of action by valence by time by genotype. Compared to the A2 homozygotes carriers of the A1 allele showed a diminished learning to withhold an action to receive a reward. Post-hoc comparisons via t-test: *p < 0.05.

