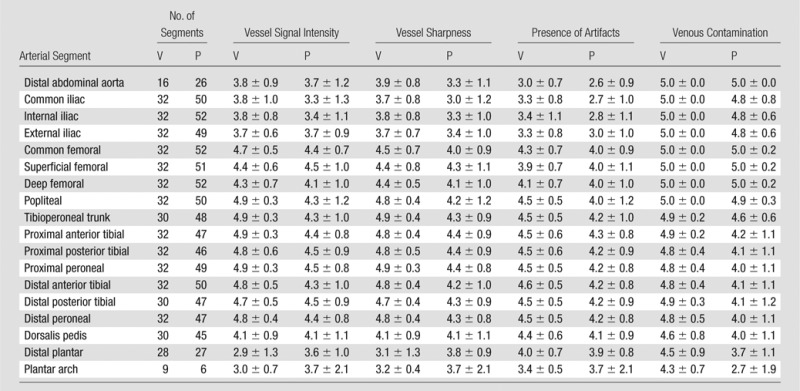
Table 2.
Vessel Segment Image Quality Assessment Scores for Both Readers in Aggregate

Note.—A five-point scale (5 = best) was used for scoring. Reader aggregate scores are reported as mean ± standard deviation. V = volunteers, P = patients.
Vessel Segment Image Quality Assessment Scores for Both Readers in Aggregate

Note.—A five-point scale (5 = best) was used for scoring. Reader aggregate scores are reported as mean ± standard deviation. V = volunteers, P = patients.