
Figure 3.
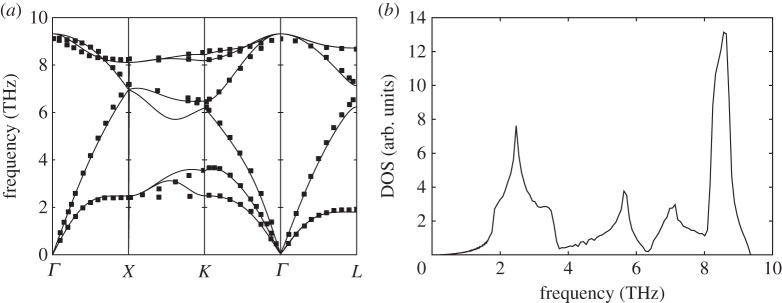
Phonon dispersion relations and density of sates for germanium (Ge). (a) Solid lines: theoretical dispersion relations obtained with the BCM, where the x-axis indicates q values along the high-symmetry directions of the Brillouin zone. Symbols: data from neutron scattering experiments [33]. (b) Density of states calculated from BCM dispersion relations.