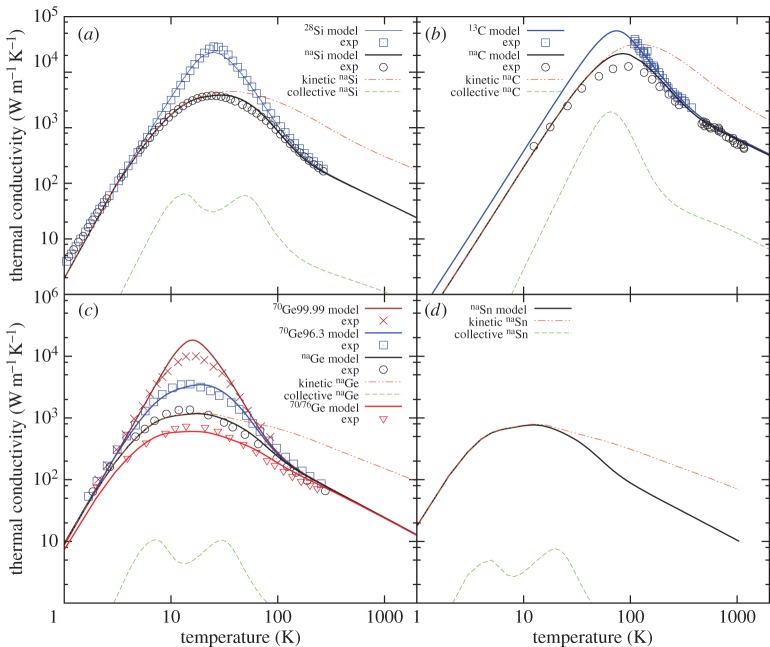
Figure 6.
Thermal conductivity of the set of group-IV semiconductors. The fit for naSi (solid line) is shown in (a). Predictions (solid lines) are shown for 28Si in (a), for diamond samples in (b), Ge samples in (c) and α-Sn in (d). The kinetic (dashed-dotted lines) and collective (dashed lines) contributions are plotted for each natural occurring samples. Experimental data from [21] for Si, from [17] for Ge and from [22,23] for C appear in symbols. (Online version in colour.)

