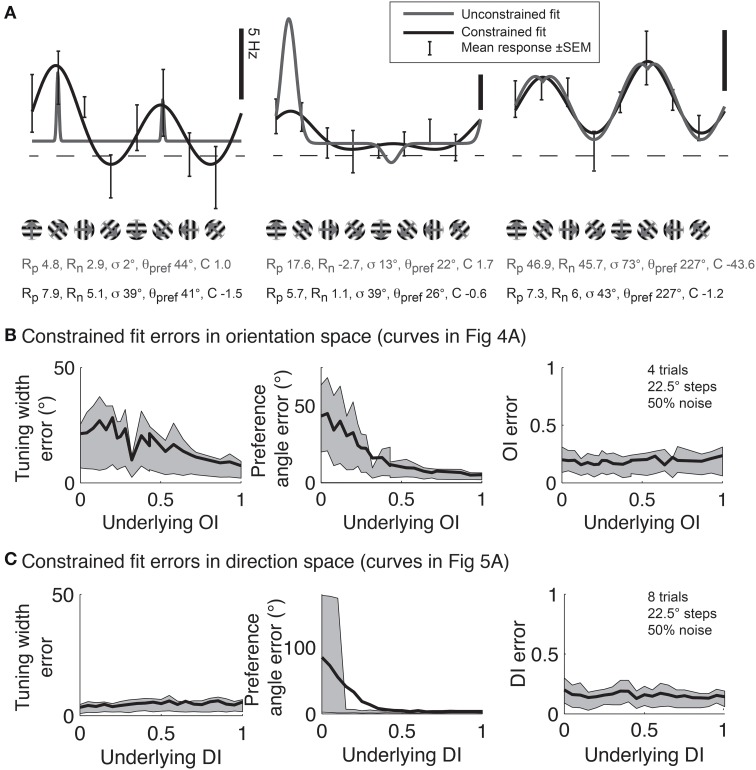
Figure 11.
Gaussian fits for assessing orientation and direction selectivity. (A) Common errors with unconstrained fits (gray lines). Left: the unconstrained fit has gotten stuck in a local squared error minimum, using a tiny tuning width to fit 2 points very accurately. Middle: The unconstrained fit has used a peak response Rp that is much larger than any point actually present in the data, and a physiologically implausible negative weight for the null direction. Right: The unconstrained fit has found a reasonable fit, but the parameters do not make physical sense. The unconstrained fit posits a constant offset that is highly negative, with large responses to the preferred and null directions. All of these fitting error can be solved by constraining the fit parameters to values that make physical sense (solid lines, see text). (B) Mean errors in tuning width, preferred angle, and OI for Monte Carlo simulations of cells with the underlying OIs in Figure 4. Gray patch indicates 25–75% interval (C) Mean errors in tuning width, preferred angle, and OI for Monte Carlo simulations of cells with the underlying DIs in Figure 5. Gray patch indicates 25–75% interval.

