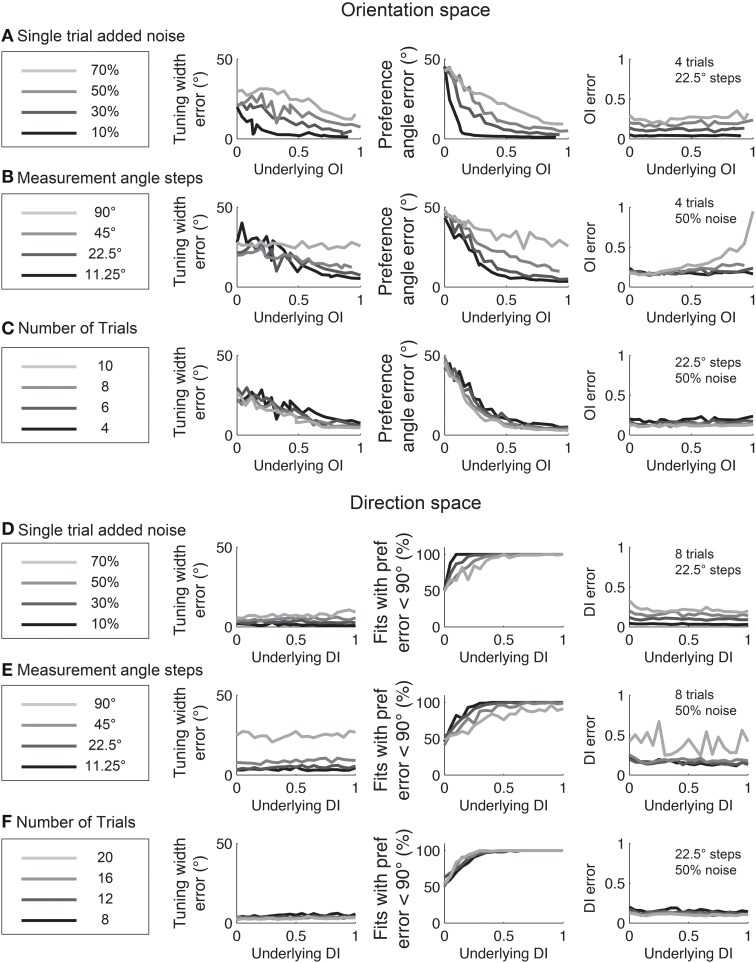
Figure 12.
The dependence of errors in identifying tuning width, preference angle, and OI/DI on neural noise and stimulus sampling. On the Y axis of all plots is the median error between the “true” underlying quantity and the value provided by the fit. (A–C) are in orientation space, and (D–F) are in direction space. (A,D) Dependence of error on single trial noise as a percentage of the maximum response rate to the preferred direction. (B,E) Dependence of error on number of angle steps. Additional angle steps offer a modest improvement in estimating the fit parameters. (C,F) Dependence of error on the number of trials. More trials offer modest improvements in average accuracy.

