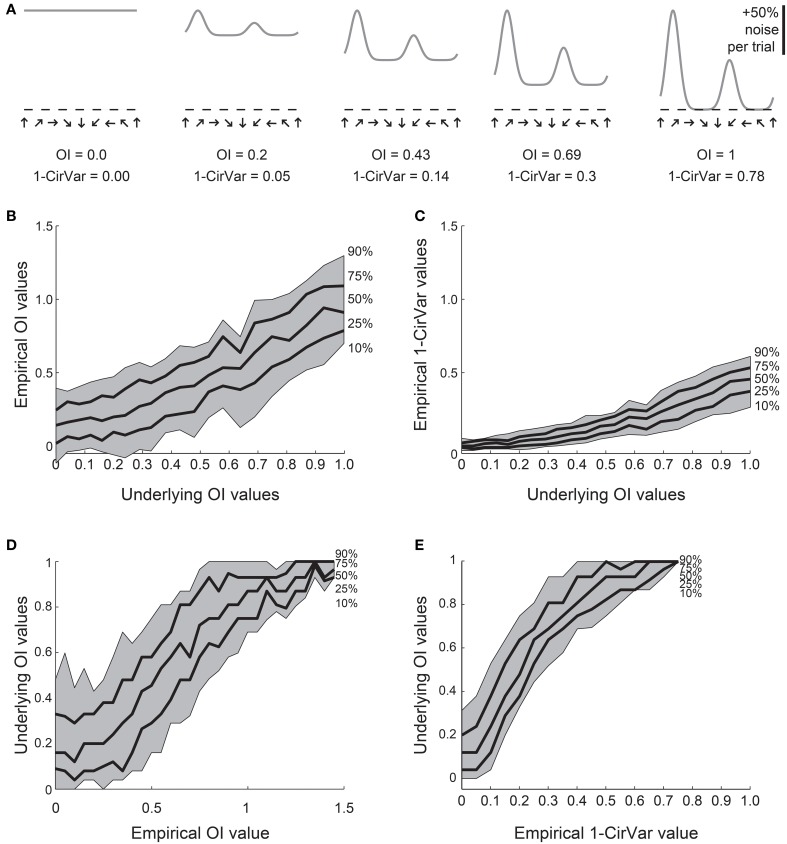
Figure 4.
Comparison of OI and circular variance measures for simulated data. We created 100 simulations of tuning curves for each of 21 underlying “true” tuning curves, ranging from OI = 0 to OI = 1, some shown in (A). Each trial had 50% noise added. (B) Percentiles of the empirically determined OI for the 100 simulations at each underlying “true” OI value. Note that for cells with 0 true selectivity, the empirical OI values range from slightly negative to almost 0.5. (C) Percentiles of the empirically determined 1-CirVar index for each of the underlying “true” OI values. Note that when “true” OI is low, the 1-CirVar is always low. The index 1-CirVar increases as “true” OI increases but the range of values remains narrower than the corresponding range of empirical OI values in (B). (D) The inverse of (B); given we observed an empirical OI value of x, what is the range of possible “true” OI values that produced x in our simulations? An empirical OI of 0 could have arisen from cells with “true” OI values ranging from 0 to 0.5, and an empirical OI of 0.5 could have arisen from cells with a “true” OI ranging from about 0.1 to about 0.8. (E) The inverse of (C). A 1-CirVar of 0 could have arisen from a “true” OI ranging from 0 to about 0.3, and 1-CirVar of 0.25 could have arisen from a “true” OI ranging from about 0.4 to 0.8. The range of possible underlying “true” OI values is much narrower when 1-CirVar is used as a readout as compared to OI.

