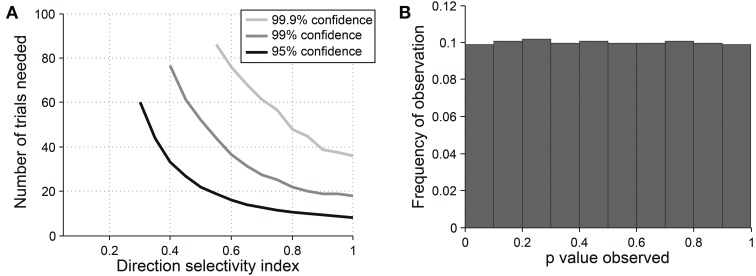
Figure 9.
Sensitivity and specificity of the direction dot product test for detecting direction selectivity. (A) Repeated simulations were performed with a single cell at different levels of underlying DI and different numbers of trials; OI = 1 for all simulations. 16 angles (22.5° steps) were used; noise = 4 Hz at all conditions. Sensitivity of the direction dot product test was measured at three levels of significance: 95, 99, and 99.9%. (B) A cell was simulated with 7 trials at underlying DI = 0, OI = 1. The simulation was repeated 200,000 times and each time a p-value was measured against H0: DI = 0. The frequency of observed p-values was uniform between 0 and 1, which is what would be expected for an unbiased test by repeated sampling of cells that are indifferent to direction.

