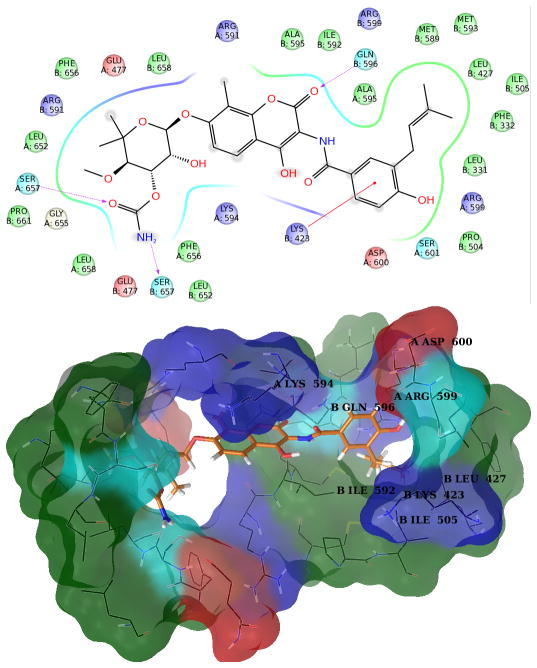
Figure 6. Structures of Novobiocin bound to Hsp90 in the fourth most populated cluster obtained from MD simulation.
Upper panel: 2D diagram of the interactions between Novobiocin and the representative structure of the fourth cluster. The ligand is displayed as a 2D structure while residues are represented as colored spheres according to their properties, labeled with the residue name and residue number. Ligand interactions with the residues are drawn as lines, colored by interaction type. Solvent exposure is indicated by the break in the line drawn around the pocket. Lower panel: 3D representation of the molecular surface formed by protein residues which have atoms closer than 5 Angstroms to the ligand. The molecular surface is colored according to the residue properties (blue, positively charged residues; red, negatively charged residues, cyan, polar residues; green, hydrophobic residues; gray, glycine).

