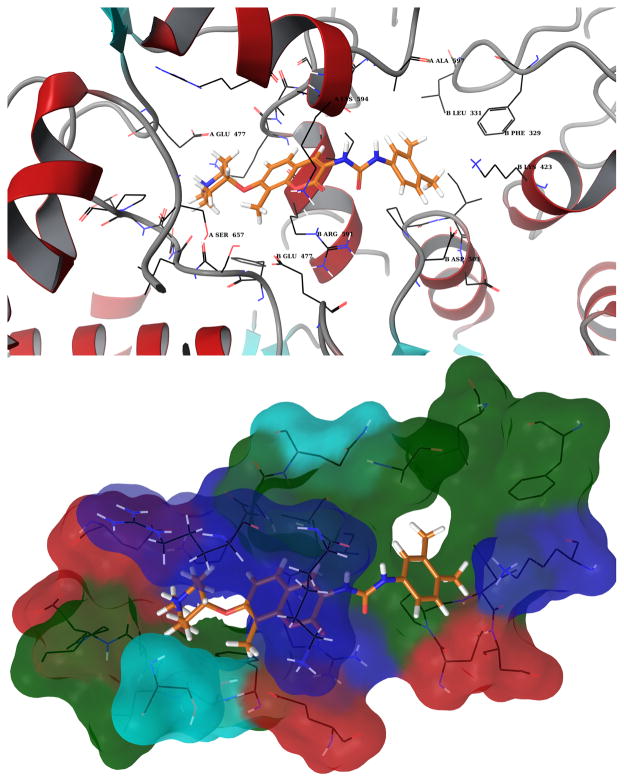
Figure 8. Structural representation of compound 10 (see Figure 7) bound to Hsp90.
Top: the protein is shown in ribbon representation and it is colored according to the secondary structure elements. Bottom: molecular surface formed by protein residues which have atoms closer than 5 Angstroms to the ligand. The molecular surface is colored according to the residue properties (blue, positively charged residues; red, negatively charged residues, cyan, polar residues; green, hydrophobic residues).

