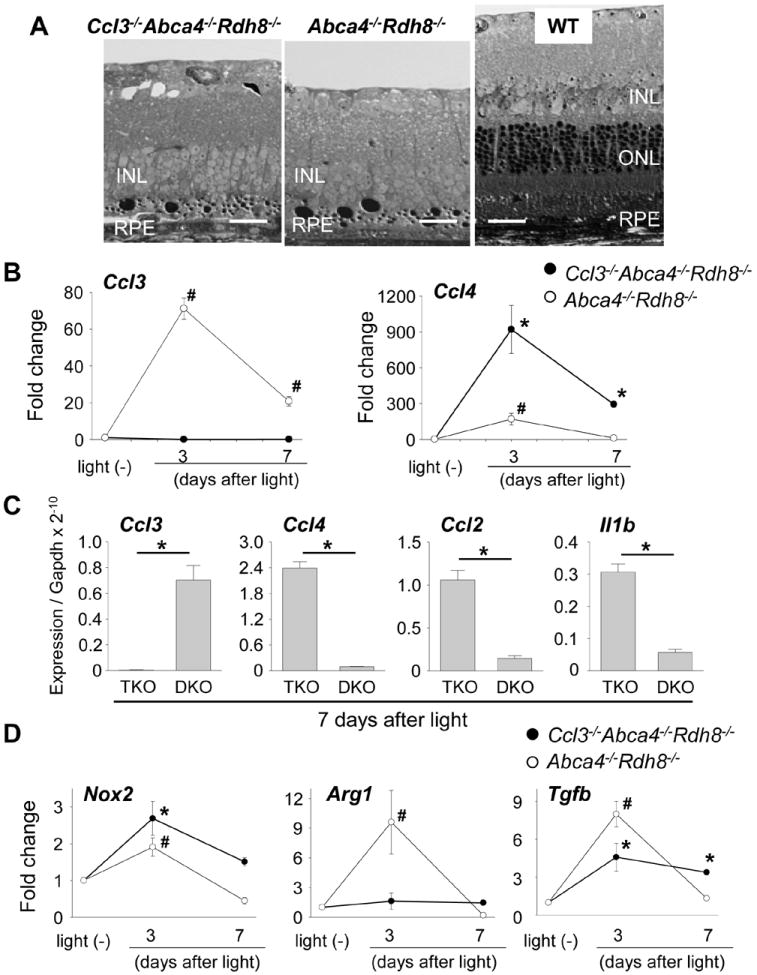
Figure 5. Elevated mRNA expressions of inflammatory molecules in the retinas of light exposed Ccl3-/-Abca4-/-Rdh8-/- mice.

A. Severity of retinal degeneration in 4-week-old Ccl3-/-Abca4-/-Rdh8-/-, Abca4-/-Rdh8-/- and WT mice after light exposure at 10,000 lux for 30 min was examined by epon-embedment sections 7 days after light exposure. B. RNA samples were collected from 16 retinas of 4-week-old Ccl3-/-Abca4-/-Rdh8-/- (TKO) and Abca4-/-Rdh8-/- (DKO) at each point. Ccl3 and Ccl4 mRNA expression levels were examined by qRT-PCR. Data are normalized by Gapdh expression and shown by fold change. Error bars indicate S.D. of the means (n = 3). # indicates P < 0.05 vs no light exposed Abca4-/-Rdh8-/- mice. C. Absolute expression levels of Ccl3, Ccl4, Ccl2 and Il1b mRNA at 7 days after light were shown when compared to Gapdh expression. Error bars indicate S.D. of the means (n = 3). * indicates P < 0.05 between each group. D. RNA samples were collected from 16 retinas of mice at each point. Expression levels of Nox2, a marker of M1 microglia/macrophage, Arg1, a marker of M2 microglia/macrophage, and Tgfb are normalized by Gapdh expression and shown by fold change. Error bars indicate S.D. of the means (n = 3). * indicates P < 0.05 vs no light exposed Ccl3-/-Abca4-/-Rdh8-/- mice. # indicates P < 0.05 vs no light exposed Abca4-/-Rdh8-/- mice.
