
Figure 6. Severer retinal degeneration in Ccl3-/-Abca4-/-Rdh8-/- mice than in Abca4-/-Rdh8-/- mice after 15 min of light exposure.
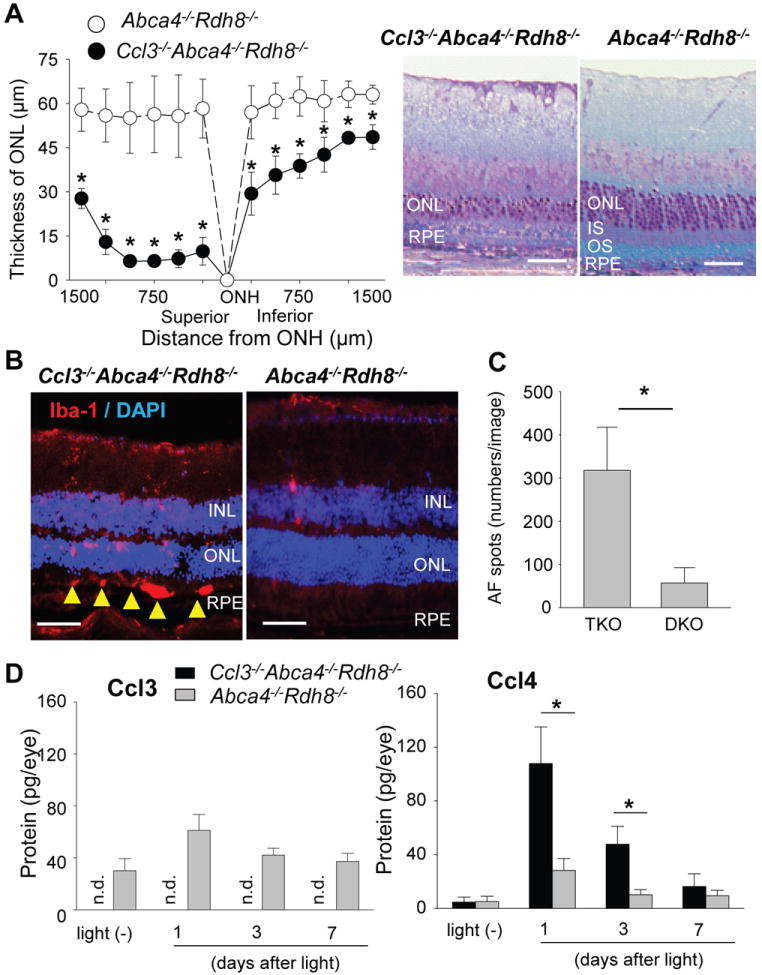
Four-6-week-old Ccl3-/-Abca4-/-Rdh8-/- (TKO) and Abca4-/-Rdh8-/- (DKO) mice were exposed to 10,000 lux light for 15 min. A. Thickness of ONL was measured by SD-OCT (left) and retinal sections (right) were prepared at 7 days after light exposure. Error bars indicate S.D. of the means (n > 6).* indicates P < 0.05 vs light exposed Abca4-/-Rdh8-/- mice. Bars indicate 50 μm. ONL, outer nuclear layer; IS, inner segments; OS, outer segments; RPE, retinal pigment epithelium. B. IHC by using anti-Iba-1, a marker of microglia/macrophage, 7 days after light exposure for 15 min are presented. Yellow arrowheads indicate infiltrated microglia/macrophages in the subretinal space. Bars indicate 30 μm. INL, inner nuclear layer; ONL, outer nuclear layer; RPE, retinal pigment epithelium. C. Numbers of AF spots were counted by using SLO. Error bars indicate S.D. of the means (n > 6). * indicates P < 0.05. D. Production of Ccl3 and Ccl4 was quantified by ELISA with eyes before and 1, 3 and 7 days after light exposure at 10,000 lux for 15 min. Two eyes from one mouse were homogenized in 500 μl of PBS with proteinase inhibitors, and the homogenates (50 μl) were used for the quantification. Error bars indicate S.D. of the means (n > 3 mice) * indicates P < 0.05. n.d. indicates not detectable.