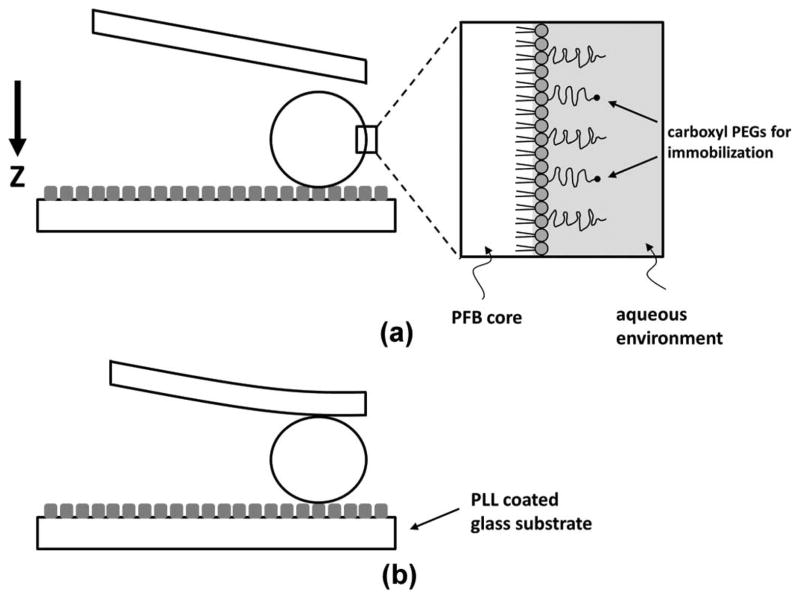
Fig. 1.
Diagram showing microbubble surface structure and attachment to the glass substrate during the atomic force microscopy measurement. Tipless cantilevers with various spring constants were used for compression. The arrow shows the piezo-crystal movement direction. A continuous 1 Hz cantilever scan rate was used. (a) As the cantilever was approaching the microbubble, (b) the shell imposed a resistance to collapse, and the force exerted on the cantilever was recorded as a function of microbubble shell deformation to calculate the system spring constant. The lipid monolayer was assumed to be an elastic spring with a constant thickness of 5 nm.

