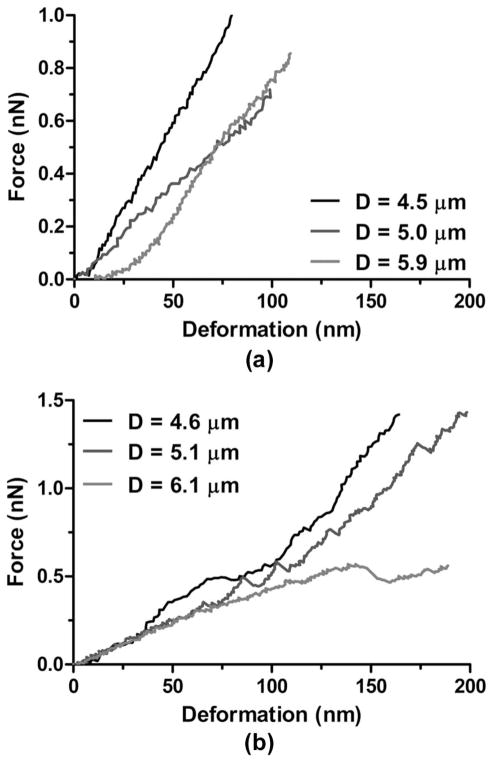
Fig. 7.
Representative force–deformation curves for microbubbles using cantilevers with the same spring constant (kc = 0.03 N/m). (a) Typical force curves for microbubbles with different diameters showing a nonlinear region when contact was initially made between the cantilever and microbubble surface followed by a linear increase where the gradient was determined as the system spring constant. (b) Typical force curves for microbubbles with different diameters showing instability regions characterized by discontinuities (i.e., jumps or steps) of the linear parts of the force curves.

