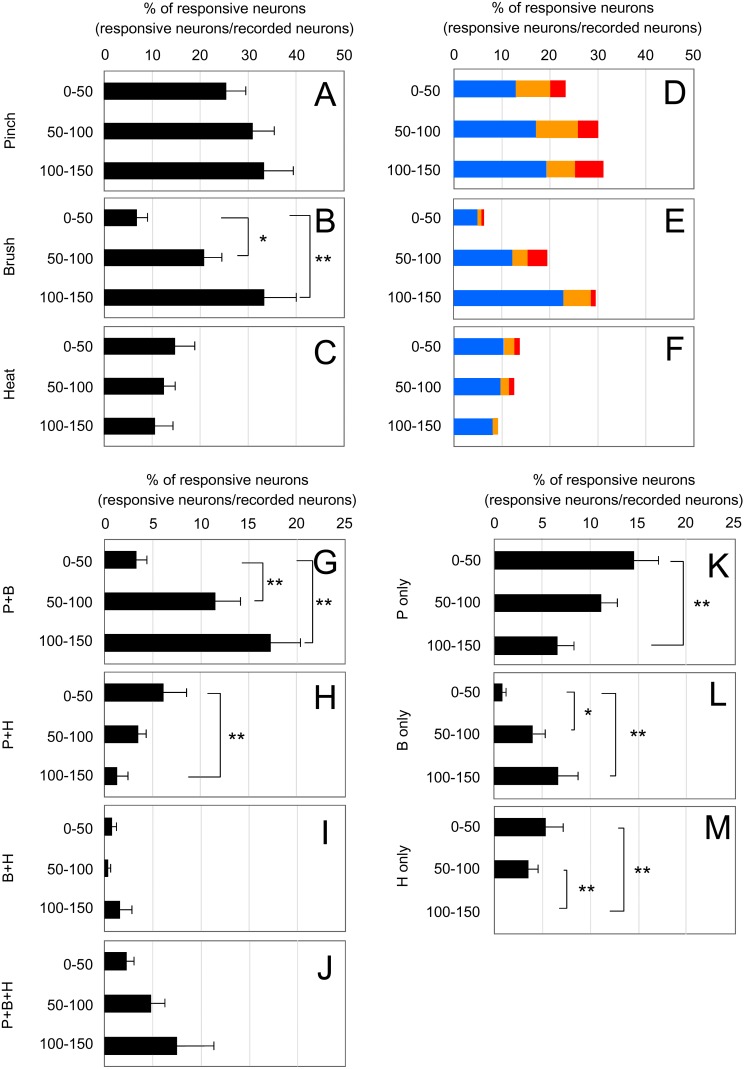
Figure 6. Lamina distribution pattern of SDH neurons in response to pinch, brush, or heat stimulation.
Following calcium imaging in response to pinch, brush, or heat stimulation, the depth of each neuron from the dorsal edge of the grey matter was measured. (A–C) Recorded neurons were classified into 3 groups according to their depth: 0–50 µm, 50–100 µm, and 100–150 µm. The percentage of responsive neurons within each depth is shown. (D–F) Total recorded neurons (785 cells) were further classified by the amplitude of their calcium transients. Red: >45%, Yellow: 30–45%, Blue: 15–30%. (G–M) Recorded neurons were classified according to the response profiles of different sensory modalities, and the percentage of responsive neurons within each depth is shown. (G) pinch (+), brush (+), heat (−) neurons. (H) pinch (+), brush (−), heat (+) neurons. (I) pinch (−), brush (+), heat (+) neurons. (J) pinch (+), brush (+), heat (+) neurons. (K) pinch (+), brush (−), heat (−) neurons. (L) pinch (−), brush (+), heat (−) neurons. (M) pinch (−), brush (−), heat (+) neurons. All values are means of 8 mice ± S.E.M. *p<0.05, **p<0.01. Data were analyzed by non-repeated measures ANOVA, and statistical significance was examined by Bonferoni posthoc comparisons (n = 8 mice; 0–50 µm: 349 cells, 50–100 µm: 337 cells, 100–150 µm: 99 cells).

