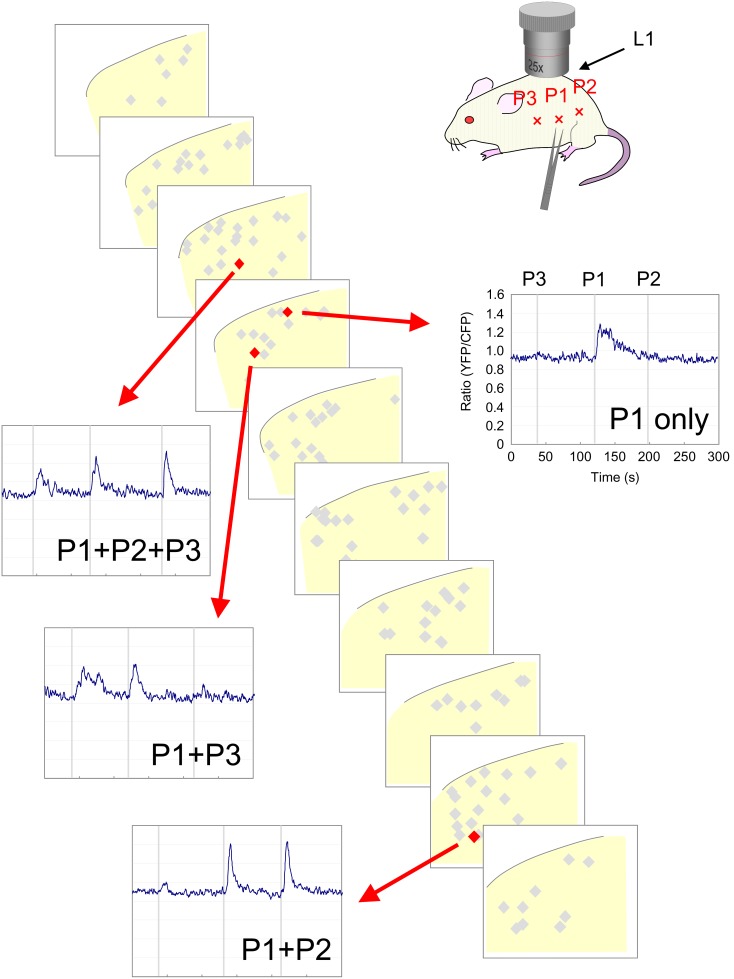
Figure 8. SDH neuronal activity in response to pinch stimulation applied to 3 different points.
Pinch stimulation was applied to 3 different points in the ipsilateral abdomen. P2 and P3 were 1-dimensional distribution of recorded neurons (grey diamonds) is shown as serial transverse sections (50 µm in thickness). The YFP/CFP ratio of 4 representative cells (red diamonds) is shown. Each trace represents the change of YFP/CFP ratio of 4 representative cells (red diamonds) in response to individual trial of pinch stimulation to P3 (left bar), P1 (central bar), and P2 (right bar).

