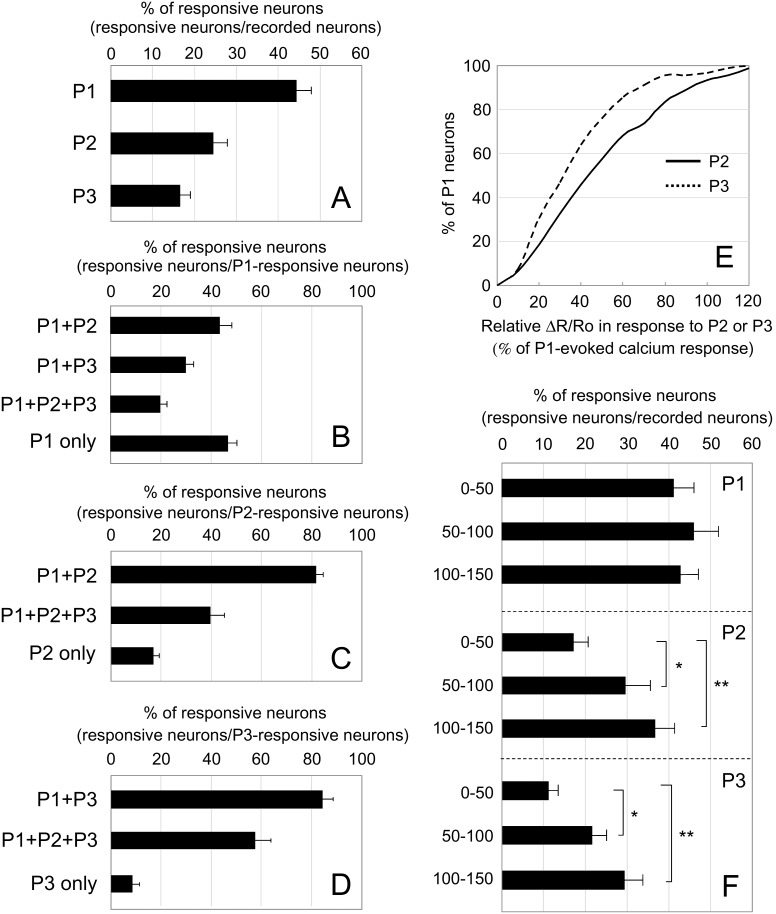
Figure 9. Activation pattern of SDH neurons in response to pinch stimulation applied to 3 different points.
Pinch stimulation was applied to 3 different points in the left (ipsilateral) abdomen, as shown in Figure 8. (A) The percentage of responsive neurons among total recorded neurons is shown in the bar graph. All values are means of 14 mice ± S.E.M. (n = 14 mice, 1068 cells). The percentage of neurons that responded to stimulation at P1 (P1), P2 (P2), P3 (P3) is shown. (B–D) The percentage of responsive neurons in each of the specified categories (see graphs) among P1-responsive (B; n = 14 mice, 458 cells), P2-responsive (C; n = 14 mice, 255 cells), and P3-responsive neuronal populations (D; n = 14 mice, 171 cells) is shown. (E) Among P1-responsive neurons (458 cells, 14 mice), 92 cells showed a strong response (ΔR/Ro>45%). The peak amplitudes of P2 and P3 stimulation relative to P1 stimulation among these 92 cells are shown as a cumulative frequency plot. (F) Recorded neurons are classified into 3 groups according to the depth from the dorsal edge of the grey matter: 0–50 µm, 50–100 µm, and 100–150 µm. The percentage of responsive neurons among each group is shown. All values are means of 11 mice ± S.E.M. *p<0.05, **p<0.01. Data were analyzed by non-repeated measures ANOVA, and statistical significance was examined by Bonferoni posthoc comparisons (n = 11 mice; 0–50 µm: 367 cells, 50–100 µm: 352 cells, 100–150 µm: 137 cells).

