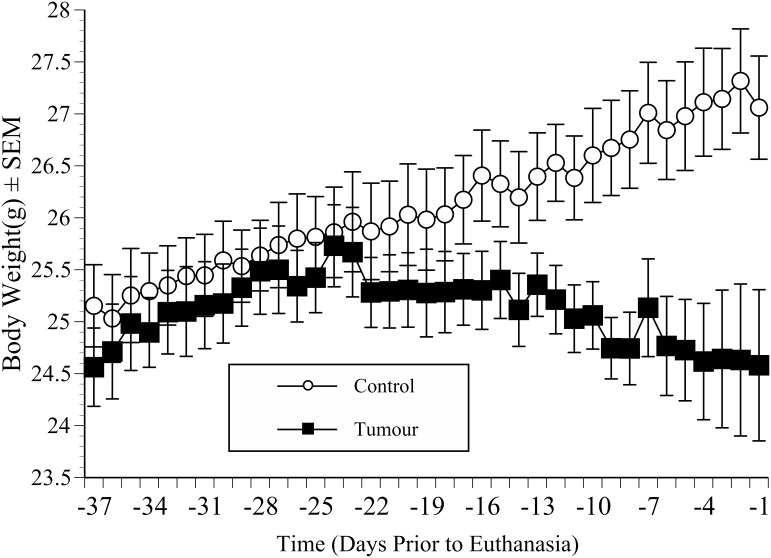
Figure 4. Body weight in catheterised mice (implanted non-surgically).
The mean (±SEM) body weight of groups of mice implanted orthotopically with either MBT-2 tumours (5×10⁶ cells/mouse; 50 µl) or an equal volume of saline, and used to collect behaviour data (n = 12 per group; graft successes only). As in Figure 3, data on days prior to euthanasia are shown following time matching (equivalent elapsed study time). Tumour-bearing mice were significantly lighter than controls from day 12 (‘Group’; p = 0.008) and progressively lost more weight until the study end.

