
Figure 3.
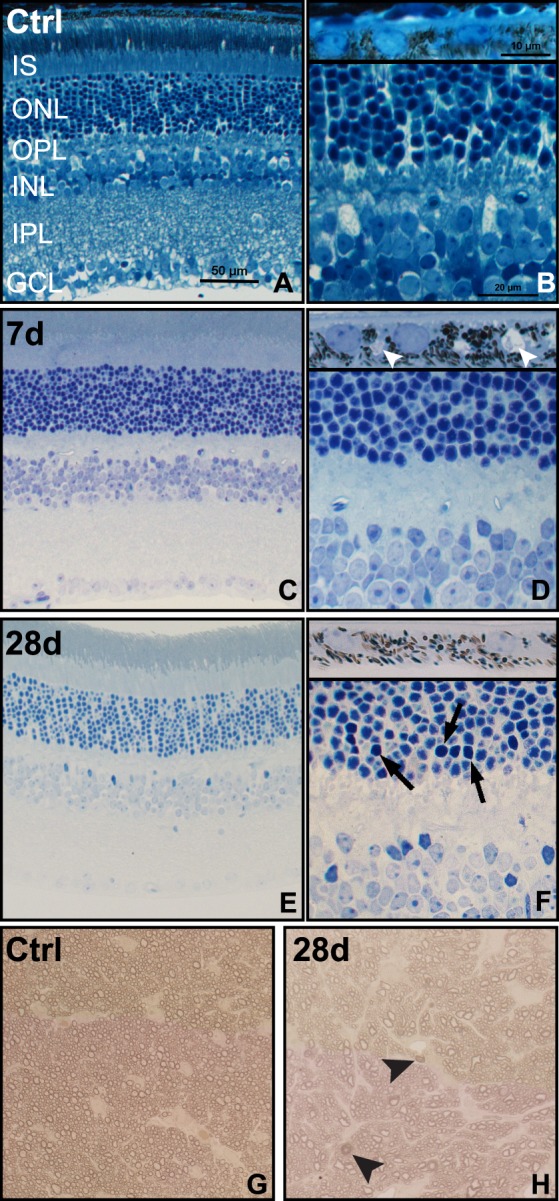
Brightfield micrographs reveal pyknotic nuclei, RPE vacuoles and axonal degeneration after blast. (A, B) Control (Ctrl) retina and RPE ([B], inset). (C, D) Seven-day postblast retina and RPE ([D], inset), small arrowheads indicate RPE vacuoles. (E–F) Twenty-eight-day postinjury retina and RPE ([F], inset), arrows indicate pyknotic nuclei. (G, H) Control (G) and 28-day postblast (H) optic nerves, arrowheads indicate degenerating axons.