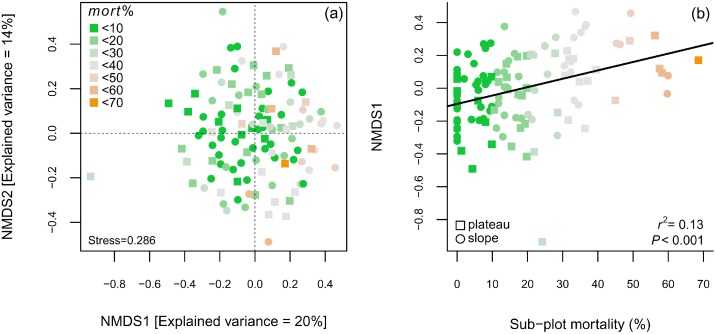
Figure 7. NMDS ordination diagram of 117 sub-plots sampled in plateaus and slopes of a forest disturbed by a large blowdown, in Amazonas, Brazil.
Sub-plot mortality caused by the blowdown is highlighted by the color-scale. Legend: (a) NMDS scores computed from a dissimilarity matrix with the abundance of all recorded species; (b) first NMDS axis related to sub-plot mortality.

